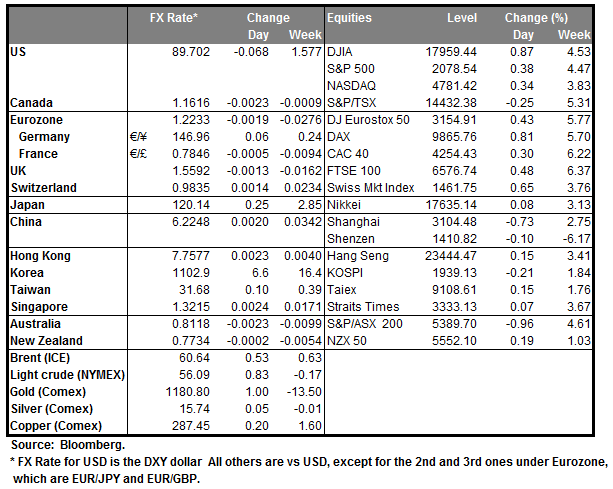
Wrong about oil I had thought the technical rally in oil yesterday would last longer than it did, but in fact it started to falter by midday in Europe. After rising a dramatic 7.5% from Friday’s lows by midday in Europe, WTI finished the US day down about 5% from its opening levels in Europe (up a modest 1.4% from Friday’s lows). I guess traders agreed with me – the idea that the global economy will come to the rescue of oil markets is more of a hope than a strategy. Sentiment was hurt by more comments from the Saudi Arabian oil minister, who said OPEC would not cut production at any price (he mentioned USD 20 a barrel!). To make matters worse, the Iraqi oil minister said his country intended to boost output next year, increasing the glut on the market. The trend in the oil market is distinctly negative for the energy-related currencies – AUD, CAD, NOKand of course RUB– over the coming months. NOKwas the worst-performing G10 currency yesterday.
Nonetheless, oil was recovering slightly in Asian trading this morning on expectations that Wednesday’s US inventories data will show a drawdown for the second week in a row. I still expect oil to become more of a two-way market for now as some short-covering is likely to come in at these low levels. That should increase volatility in the oil-related currencies.
RUB recovered substantially despite the fallback in oil prices. It appears that exporters are responding to government pressure to sell foreign currencies, especially as tax payment deadlines approach. Moreover the Russian FX market will be closed from Jan. 1st and only reopen on Jan. 12th, so investors shorting the RUB may be closing out their positions ahead of that time rather than take the risk along with the negative carry. I doubt though if this is the end of the story for RUB, as it looks like the price of energy – which makes up about two-thirds of the country’s exports -- are not going to recover substantially any time soon.
Lower oil prices and a rising dollarpressured gold, which crashed through several support levels to trade near a three-week low. Who needs an inflation hedge now? And with US stocks rising into record territory (see below) and Chinese stocks doing well too, many investors see better things to do with their money.
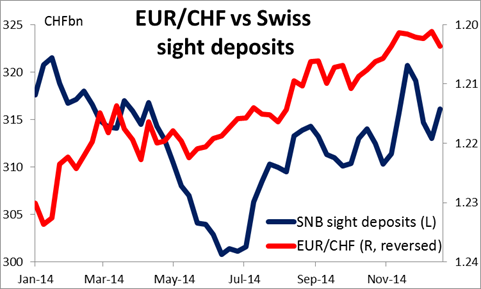
Sight deposits at the Swiss National Bank (SNB) rose by only CHF 3.11bn or about 1% last week. This figure – cash-like holdings of commercial banks at the central bank – is a loose proxy for FX intervention. The figure was lower than expected, because analysts had assumed that only major intervention would have forced the SNB to impose negative deposit rates. (The December FX reserve data will be released on Jan. 7th.) The fact that the SNB imposed the negative rates in such circumstances shows their determination to keep the EUR/CHF floor intact. Swiss short-term yields fell further into negative territory as the market priced in further action from the SNB. Market confidence in the EUR/CHF floor is high and it seems to be as close to a one-way bet as exists in the FX world today.
TheS&Pclosed up again for the fourth day in a row to hit a record high, by definition also a high for the year. Apparently this is the first year since 1928 (at least) that the market has not been down four days in a row! Such good performance makes investment professionals nervous – their starting point for 2015 is a record high and thus it may be difficult for them to deliver gains.
Today’s schedule: During the European day, we get the final GDP figures for Q3 from several countries. In France and the UK, the final Q3 GDP data are expected to confirm the preliminary growth figures. Following the concerns from the BoE MPC members over the heightened risk on growth in the December meeting minutes, we could see a decline in the final Q3 growth rate. This could prove GBP-negative.
In Norway, the AKU unemployment rate for October is expected to remain unchanged at 3.7%. The official unemployment rate for the same month had remained unchanged, thus the possibility for a positive surprise is limited which could keep NOKunder selling pressure.
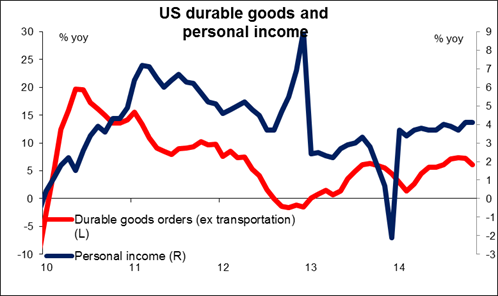
We have a very busy day in the US with several important figures expected to show strong growth, which may boost the dollar. The 3rd estimate of Q3 GDP is expected to show that the US economy expanded at a faster pace than initially estimated. The 3rd estimate of the core personal consumption index, the Fed’s favorite inflation measure, is forecast to have remained unchanged from the 2nd estimate. The monthly rate of the core PCE and PCE deflator for November are also coming out and the forecast is for both to decelerate a bit. Durable goods orders for November are expected to be good: the headline figure is expected to accelerate, while the figure excluding transportation equipment is estimated to rebound from the previous month. Personal income and personal spending for November are also expected to accelerate, adding to the overall positive data. The Richmond Fed manufacturing index and the final University of Michigan confidence index, both for December are also coming out. The Federal Housing Finance Agency (FHFA) home price index for October and new home sales for November are likely to show that the housing sector is on a strong path. Overall, the strong data are probably going to show that the US economy is on a strong path. This is likely to keep the USD supported and confidence up.
Canada’s GDP for October is also due out.
On Tuesday Greece holds the second round of its Presidential election. Last week, the government’s candidate got only 160 votes, far below the 200 needed to win. He’s likely to lose today’s vote as well. The focus is therefore on the December 29th vote when he only needs 180 votes to win and thereby avert a general election.
The Market
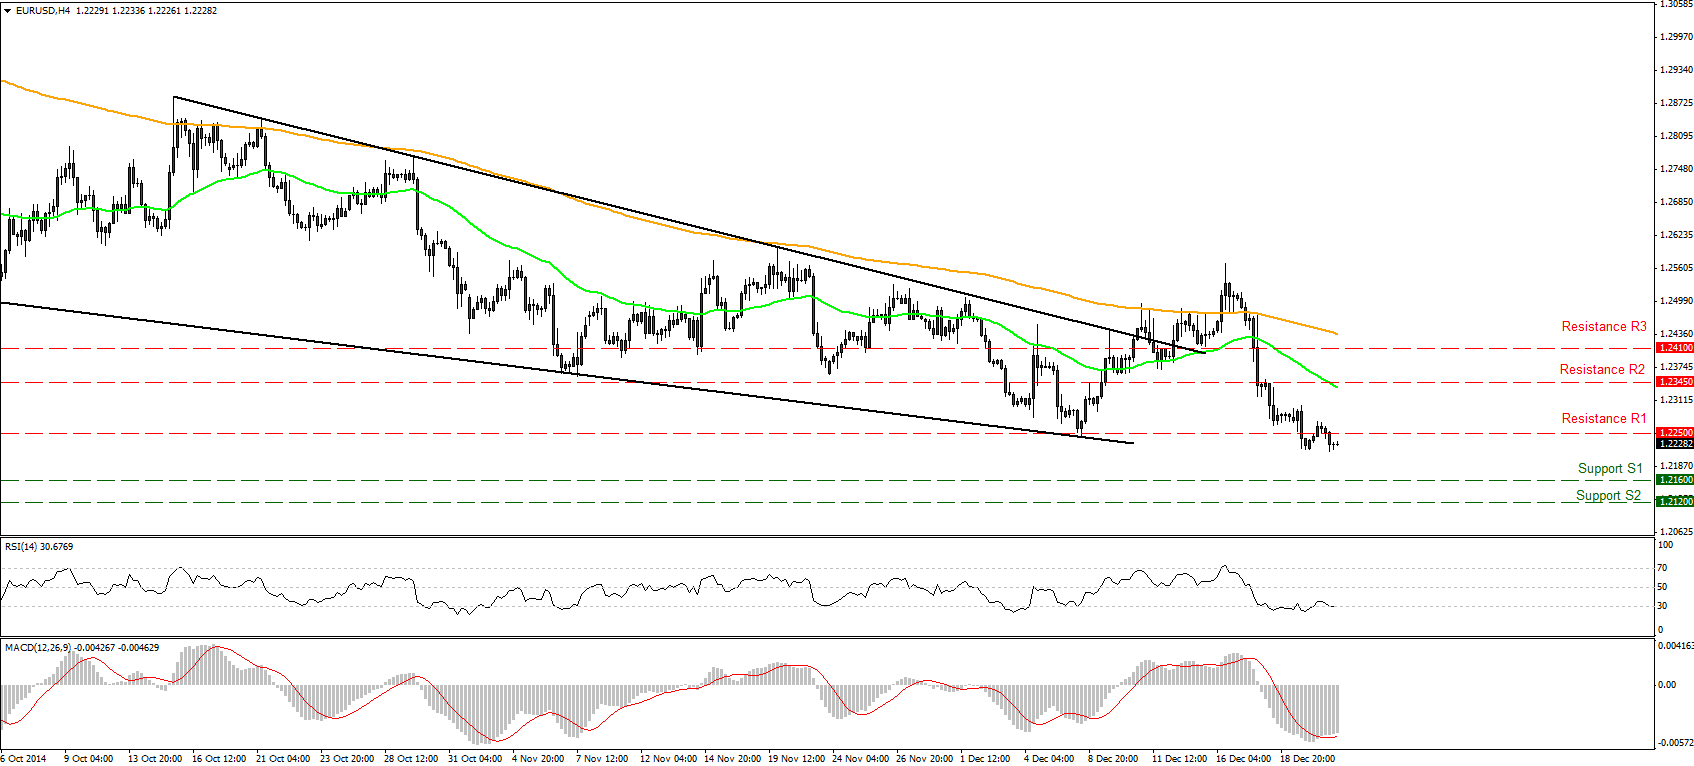
EUR/USD moved up somewhat on Monday but found resistance around the 1.2250/60 (R1) area and fell back below that level. I would expect the failure to breach that resistance zone to push the rate even lower, probably towards our next support of 1.2160 (S1), the lows of 3rd of August 2012. Looking at our short-term momentum studies, the RSI found support at its 30 line and moved along with it, while the MACD, although in its negative territory, crossed above its trigger line and moved a bit up. These mixed momentum signs suggest that we could see a small upward correction before the bears take the reins again. In the bigger picture, the rate is still printing lower lows and lower highs below both the 50- and the 200-day moving averages and this keeps the overall path to the downside.
• Support: 1.2160 (S1), 1.2120 (S2), 1.2050 (S3)
• Resistance: 1.2250/60 (R1), 1.2345 (R2), 1.2410 (R3)
USD/JPY a touch above 120.00
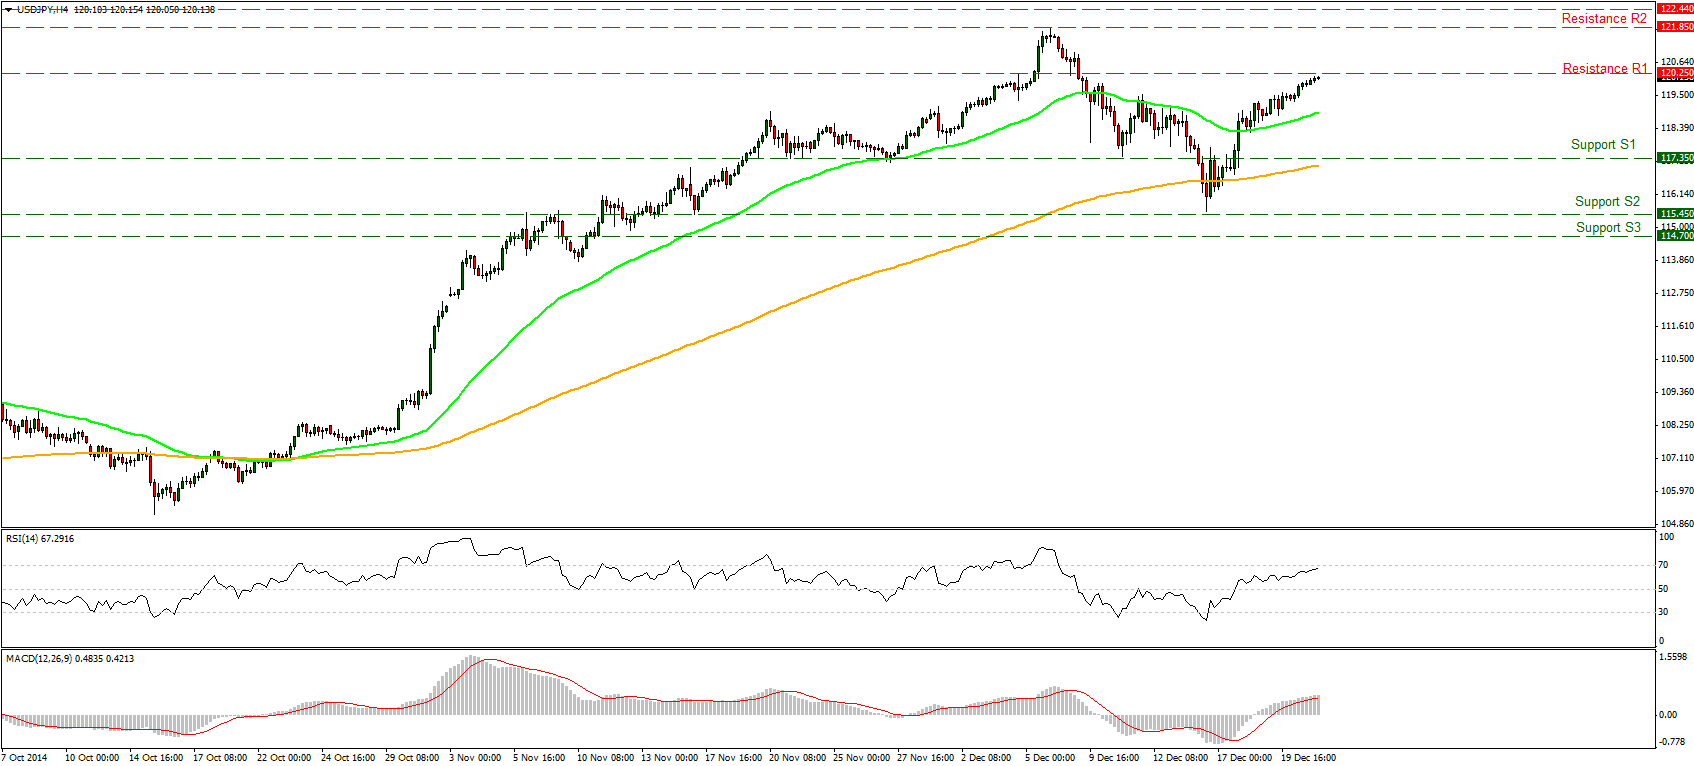
USD/JPY advanced on Monday and rose just above the psychological level of 120.00. Since I am not convinced that this is a solid break of that level, I would wait for a break above 120.25 (R1) to see further advances, perhaps towards our next resistance line of 121.85 (R2). Looking at our short-term momentum signals, the RSI lies just below the 70 line, while the MACD, already above its trigger line, moved further into its positive territory but shows signs of topping. The momentum signs support the notion for another leg up, at least temporarily, but as I said above I would wait for a clear break above the 120.25 (R1) level to get confident about further advances. As for the broader trend, the price structure is still higher highs and higher lows above both the 50- and the 200-day moving averages and this keeps the overall path of the pair to the upside.
• Support: 117.35 (S1), 115.45 (S2), 114.700 (S3)
• Resistance: 120.25 (R1), 121.85 (R2), 122.44 (R3)
GPB/USD in a consolidative mode
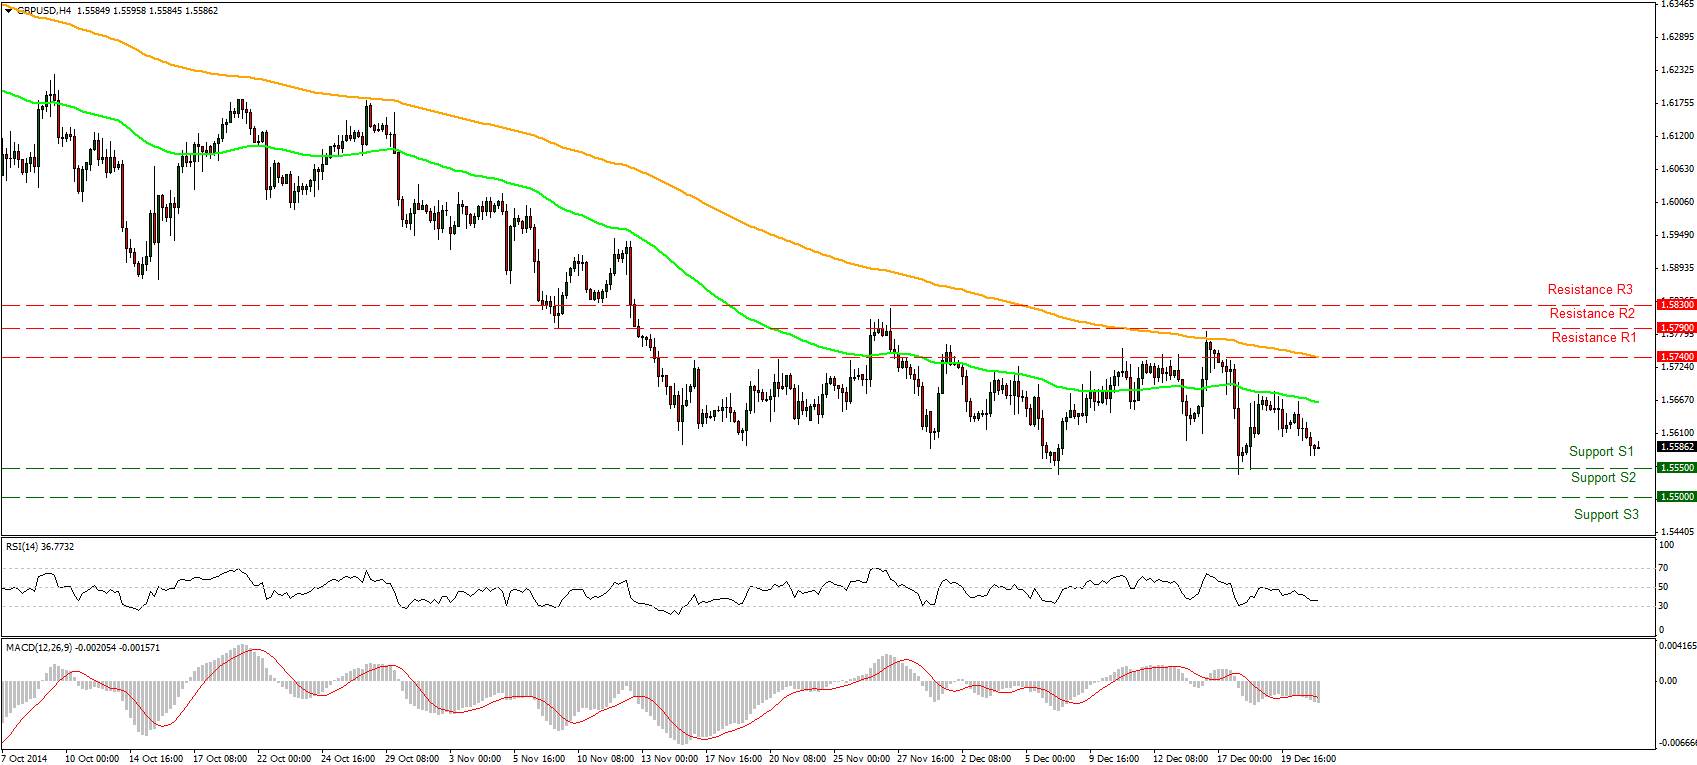
GBP/USD is still in a consolidative mode trading just above our 1.5550 (S1) support line. With no clear trending direction on the 4-hour chart, I would maintain a neutral stance as far as the short-term picture is concerned. This is supported by our short-term momentum signals. The RSI found support near its 30 line, while the MACD lies below its zero and trigger lines, increasing the case for an initial test of the 1.5550 (S1) level. A clear break of that level is needed for another leg down. As for the broader trend, I still believe that as long as Cableis trading below the 80-day exponential moving average, the overall path remains negative.
• Support: 1.5550 (S1), 1.5500 (S2), 1.5420 (S3)
• Resistance: 1.5740 (R1), 1.5790 (R2), 1.5830 (R3)
WTI plunged but found buy orders near the 54.4 level
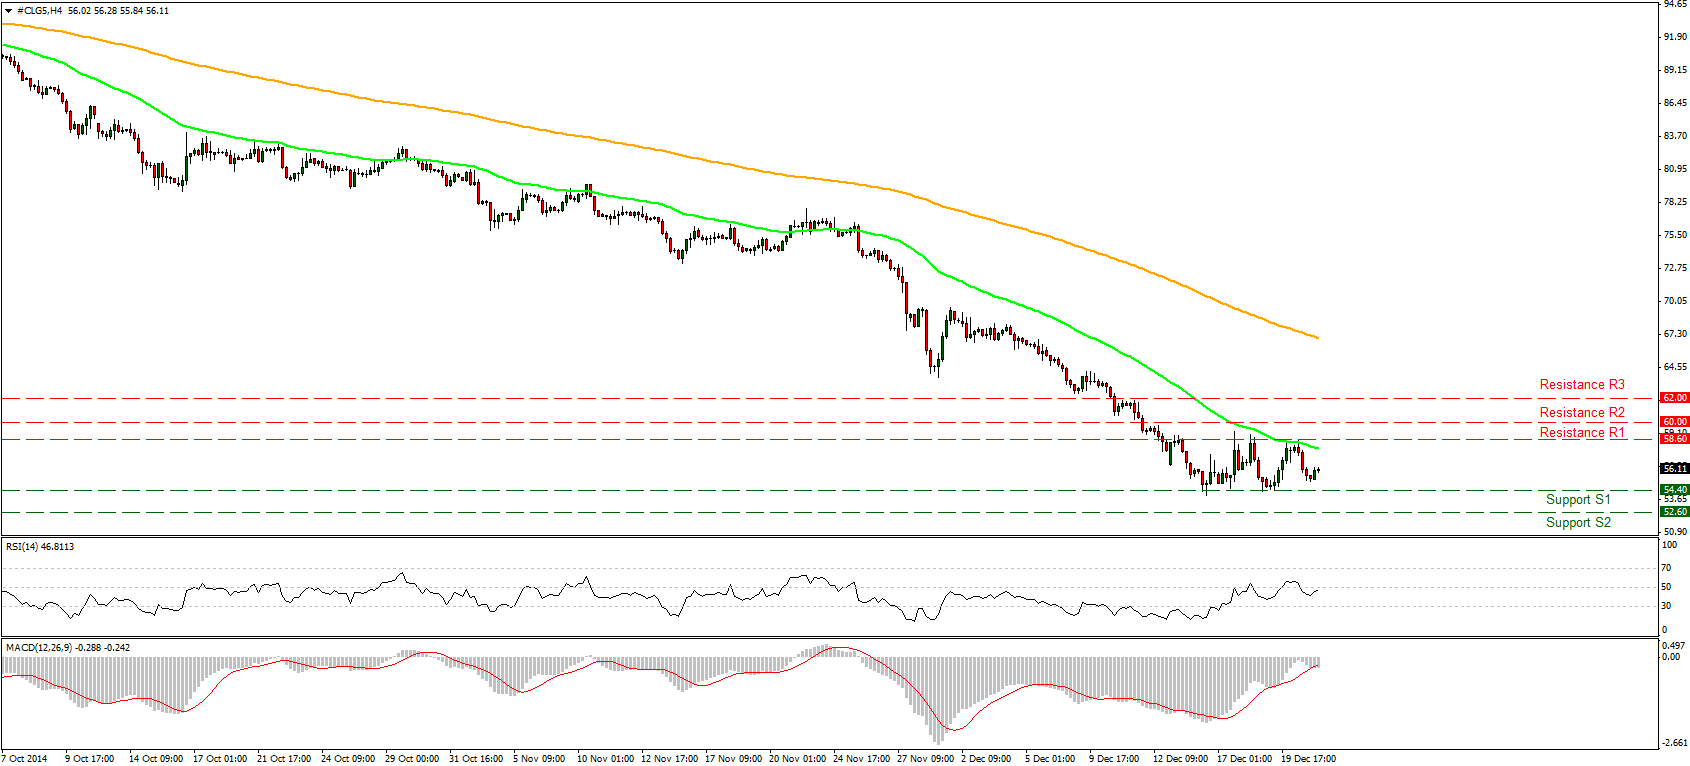
WTI dipped briefly to find some buy orders a few cents above our support area of 54.40 (S1). Following the sharp declines in the recent months, WTI seems to have stabilized within the resistance line of 58.60 (R1) and the support level of 54.40 (S1). Looking at our short-term momentums, the RSI found resistance near its 50 line, while the MACD crossed below its trigger line and is pointing sideways. These momentum signals suggest that the consolidation within the aforementioned levels is likely to continue and a decisive break in either direction is probably going to determine the near-term bias. On the daily chart, the overall path remains to the downside therefore I could treat any upside wave as a correction of the longer-term downtrend.
• Support: 54.40 (S1), 52.60 (S2), 50.50 (S3)
• Resistance: 58.60 (R1), 60.00 (R2), 62.00 (R3)
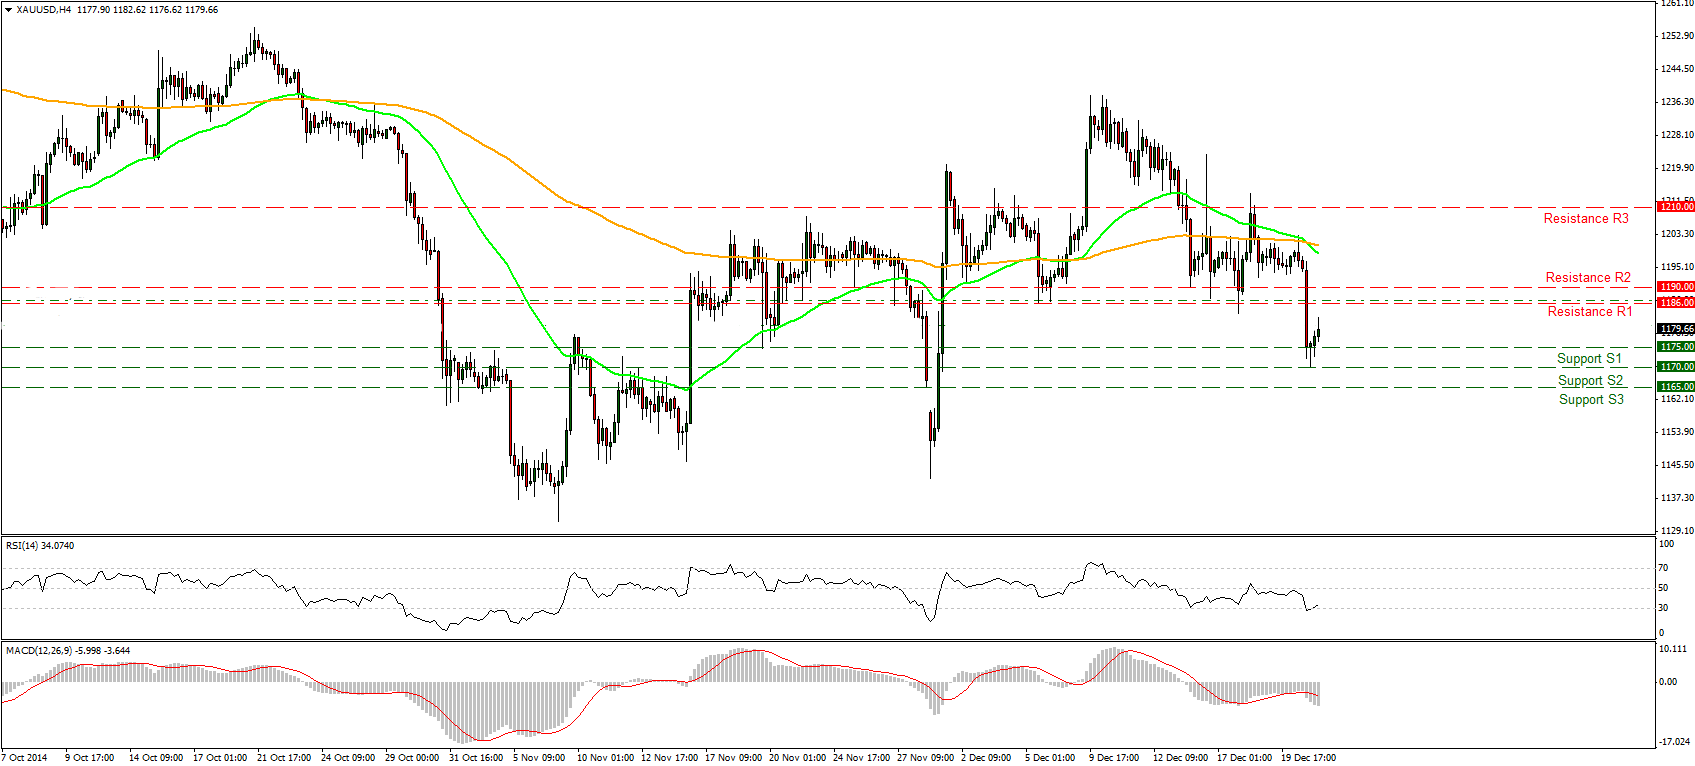
Gold remains capped within 1210 and 1190 levels
Gold plunged on Monday and broke two support lines in a row. The precious metal found support near the 1170 (S2) area and bounced a bit up. During the early European hours the price is heading towards our support-turned-into-resistance line of 1186 (R1). A break above that level is necessary for further advances. Our short-term momentum signals support the notion for an initial test of 1186 (R1) resistance zone. The RSI found support at its 30 line and moved up, while the MACD, although below its zero and trigger lines shows signs of bottoming. If the bulls fail to push the price higher, we could see gold falling again below the 1175 (S1) support line.
• Support: 1175 (S1), 1170 (S2), 1165 (S3)
• Resistance: 1186 (R1), 1190 (R2), 1210 (R3)

