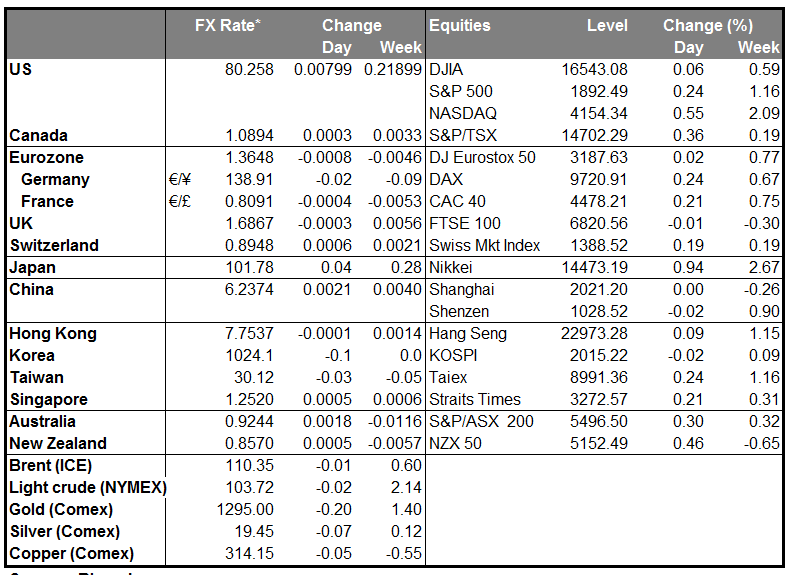
The dollar was higher against most of the other G10 currencies during the early European morning, Friday. It was lower only against CAD and virtually unchanged against NOK. The losers were SEK, AUD, EUR, JPY, GBP, CHF and NZD in that order.
The Australian dollar was among the main losers as the rally on the better-than-expected Chinese manufacturing data from HSBC did not last for long. As mentioned in previous comments, I see a mildly bearish picture since a decisive dip below 0.9200 could signal the completion of a trend reversal, in my view. The New Zealand dollar also declined, but less than its Australian counterpart, enhancing my view of a weaker AUD/NZD in the future.
The British pound also declined after the second estimate of the UK GDP for Q1 came in line with market estimates at +0.8% qoq. GBP was rising ahead of the release, probably in anticipation of an upward revision after March’s retail sales figures were revised up on Wednesday. However, as soon as the data came out merely in line with expectations, the pair declined to trade below its pre-rally levels.
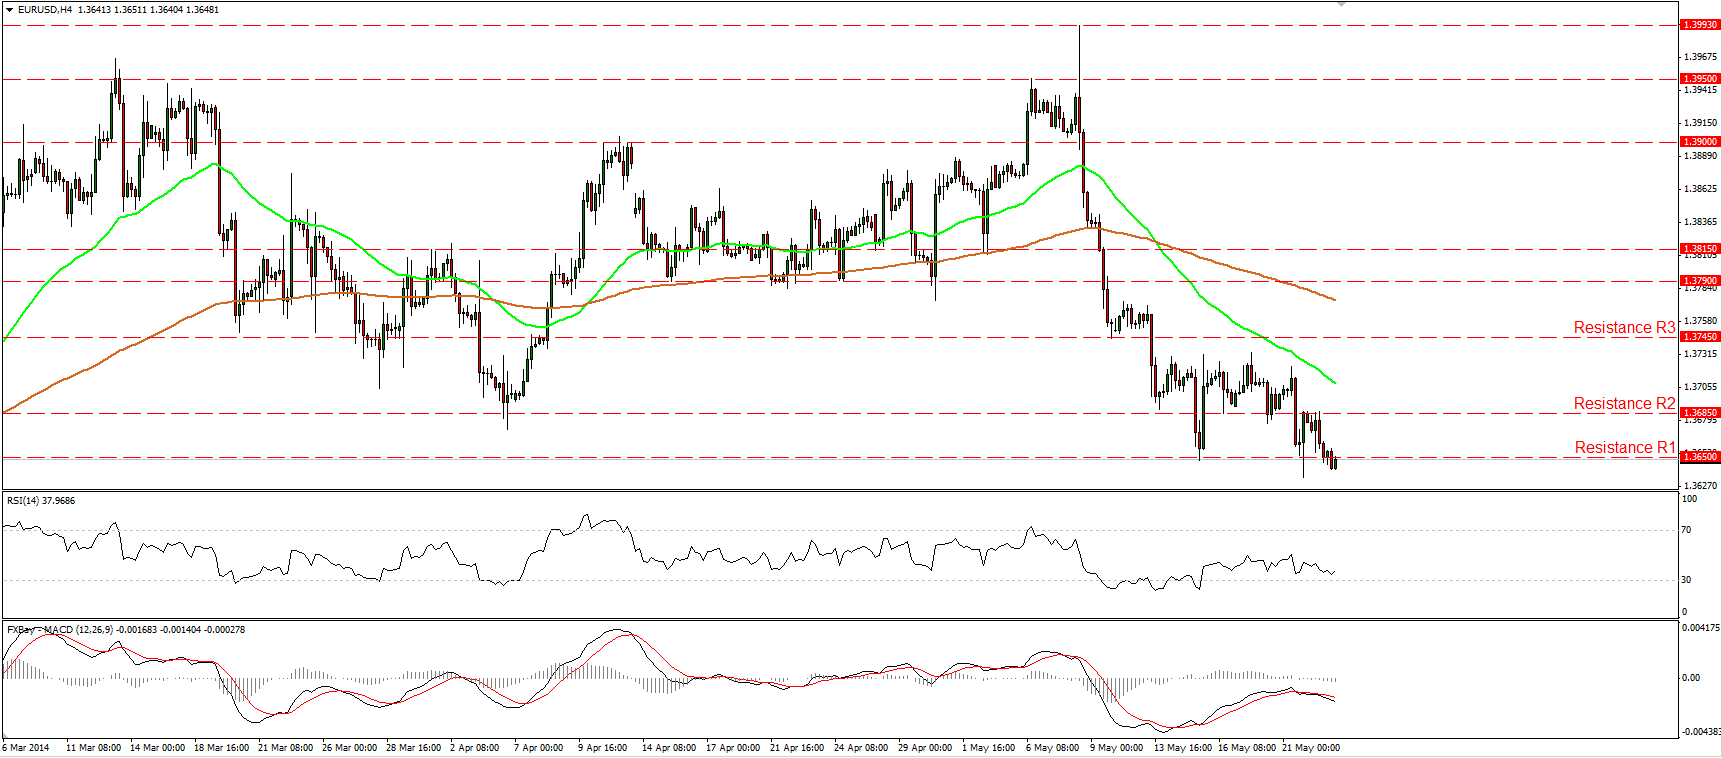
The preliminary manufacturing and service-sector PMIs for May from France, Germany and eurozone as a whole were also announced on Thursday. The French data started the day, coming out not just lower than expected but even worse, falling below the 50 barrier. EUR/USD declined at the release, but found support after the service-sector PMIs from Germany and Eurozone as a whole exceeded estimates. Nonetheless, the support was limited and at the time of writing the pair is found trading below 1.3650. This confirms my view that any upside waves should remain limited as the ECB has more than hinted it is likely to cut rates at its June council meeting and market participants are now faster to sell rallies than to buy dips.
The Canadian dollar was the only winner, maybe in anticipation of the acceleration in Canada’s CPI coming out later in the day. The headline inflation rate is estimated to have accelerated to +2.0% yoy from +1.5% yoy and the core CPI to quicken slightly to +1.4% yoy from +1.3% yoy. This could prove CAD-positive, but in the longer run I would expect USD/CAD to move higher, given that the BoC said at its latest policy meeting that a weakening local currency would support the nation’s exports. The likely course of Canadian monetary policy is diverging from that of the US, which we expect will support USD/CAD.
The main event today will be the German IFO survey for May. The current assessment index is expected to rise slightly to 115.4 from 115.3, but the expectations index is estimated to decline to 106.5 from 107.3. This kind of mixed picture – happy with the way things are but pessimistic about the future – has been the usual pattern recently in Germany. For example, the ZEW survey on May 13th came out mixed, with the expectations index declining and driving EUR/USD down about 20 pips. Based on that, investors may give more attention on the Ifo expectation index, which is forecast to decline, and push the common currency lower. The final German GDP for Q1 is also coming out. The forecast is the same as the initial estimate.
From the US, we only get new home sales for April, which are expected to have improved along with existing home sales.
Two ECB speakers are scheduled on Friday. ECB Governing Council member Luis Maria Linde and ECB Executive Board member Sabine Lautenschläger speak in Madrid.
On Sunday, we have the European elections and the presidential elections in Ukraine.
The Market
Is EUR/USD ready for the 1.3600 hurdle?
EUR/USD fell below the 1.3650 barrier, after finding resistance at 1.3685 (R2). If the bears are strong enough to maintain the rate below 1.3650 (R1), I would expect them to target the support of 1.3600 (S1). Both the RSI and the MACD moved lower, with the latter one lying below both its zero and signal lines, confirming the bearish momentum of the price action. In the bigger picture, the 1.3600 (S1) zone coincides with the 200-day moving average, thus, a decisive dip below that zone could have larger bearish implications targeting the lows of February at 1.3475 (S2).
• Support: 1.3600 (S1), 1.3475 (S2), 1.3400 (S3).
• Resistance: 1.3650 (R1), 1.3685 (R2), 1.3745 (R3).
EUR/JPY in a retracing mode
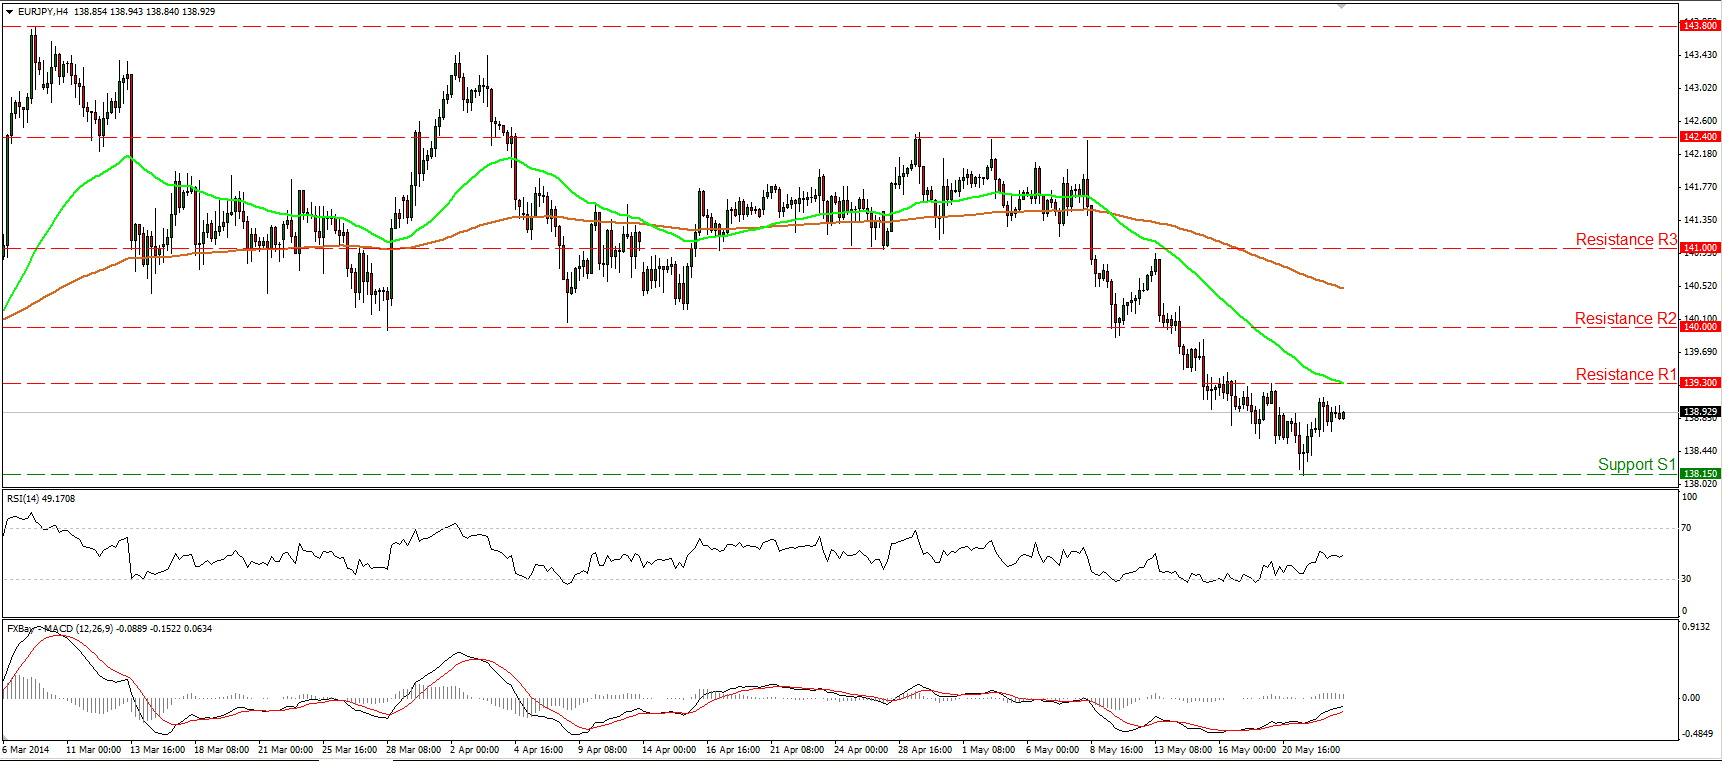
EUR/JPY moved higher after finding support at 138.15 (S1). Currently, the rate is heading towards the resistance of 139.30 (R1), near the 50-period moving average. A decisive move above that strong resistance zone, could trigger extensions towards the psychological barrier of 140.00 (R2). Nonetheless, as long as the rate is printing lower highs and lower lows below both the moving averages I still see a negative short-term outlook, and thus, I would consider any further advance as a corrective phase. The RSI follows an upside path, while the MACD, already above its trigger line, is getting closer to its zero line, favoring further correction.
• Support: 138.15 (S1), 137.55 (S2), 136.20 (S3).
• Resistance: 139.30 (R1), 140.00 (R2), 141.00 (R3).
GBP/USD lower after hitting the 1.6900 zone
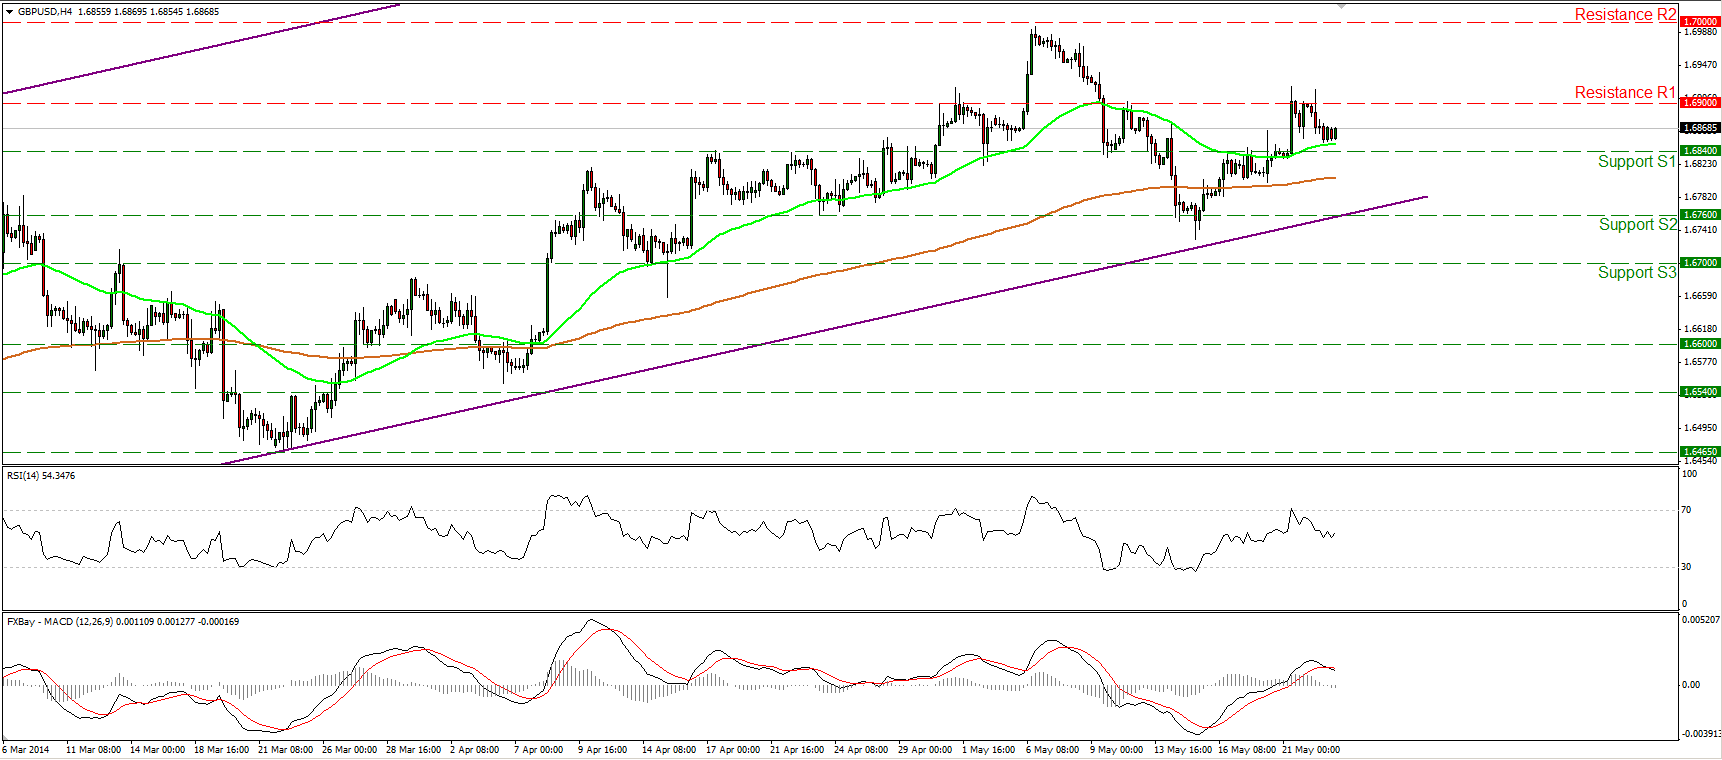
GBP/USD moved lower after finding resistance at the area of 1.6900 (R1). During the early European morning, the pair is trading near the 50-period moving average, slightly above the support of 1.6840 (S1). A clear move above the resistance of 1.6900 (R1) could pave the way for another test at the 1.7000 (R2) zone. My concern is that the RSI moved lower after finding resistance near its 70 level, while the MACD, although in its bullish territory, fell below its trigger line. Thus some consolidation of further pullback cannot be ruled out. In the bigger picture, the rate remains within the long-term upside channel, but the negative divergence between the daily MACD and the price action remains in effect. As a result, I would maintain a neutral stance as far as the long-term picture is concerned.
• Support: 1.6840 (S1), 1.6760 (S2), 1.6700 (S3).
• Resistance: 1.6900 (R1), 1.7000 (R2), 1.7100 (R3).
Gold meets resistance slightly below 1305
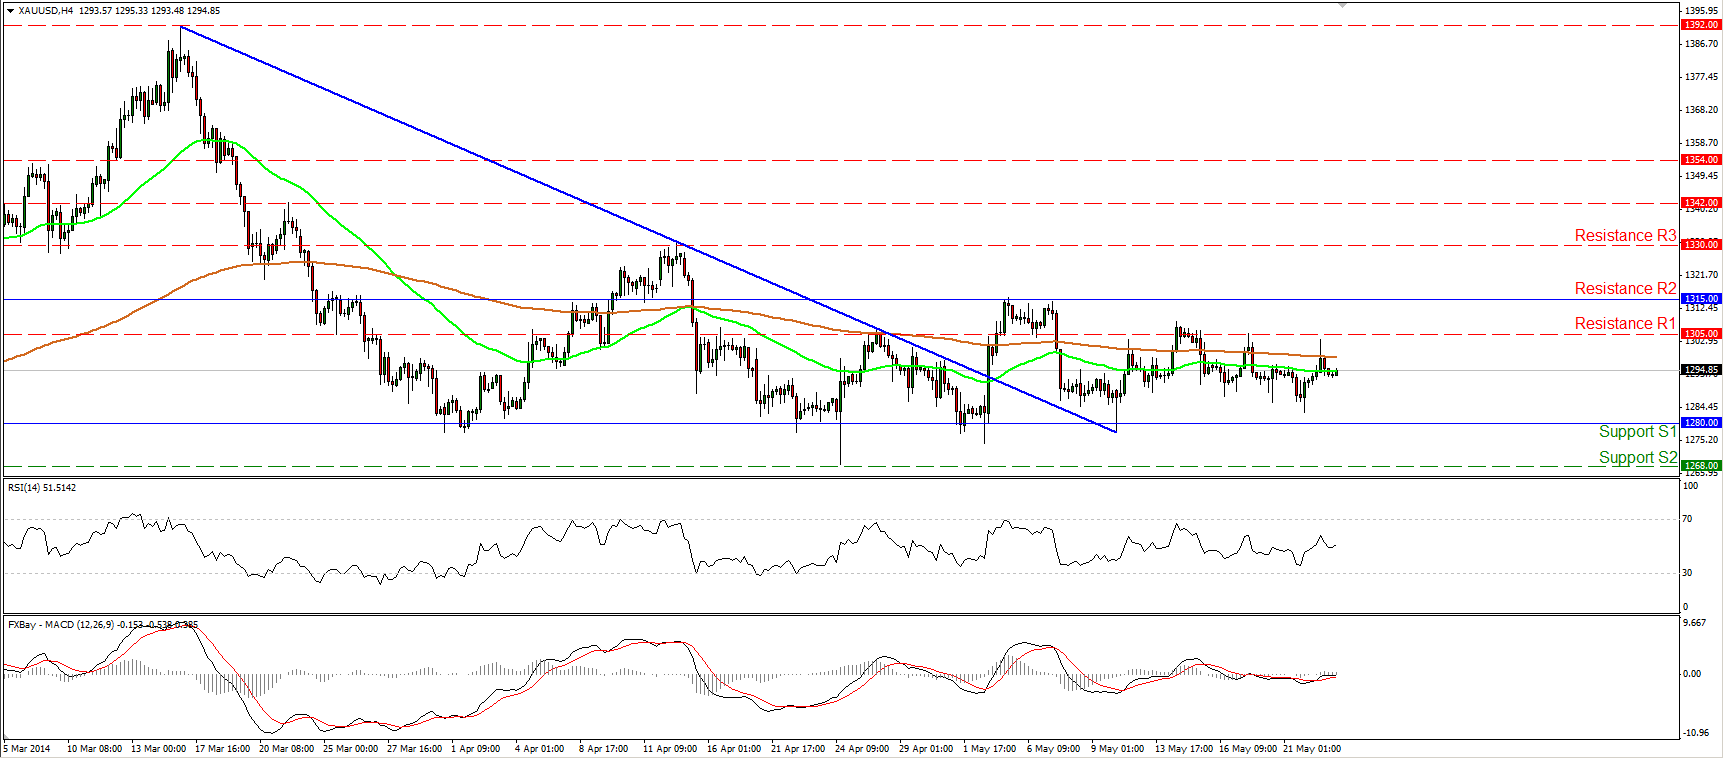
Gold tried to move higher on Thursday, but met resistance slightly below the 1305 (R1) bar and moved lower to settle near the moving averages. The precious metal continues to prefer a sideways path between the support of 1280 (S1) and the resistance of 1315 (R2). Both our moving averages continue to point sideways, while both the daily MACD and the daily RSI lie near their neutral levels, confirming the trendless picture of the yellow metal. A break above 1315 (R2) is needed to turn the picture positive and could target the resistance of 1330 (R3), while a dip below 1280 (S1) may see the support of 1268 (S2).
• Support: 1280 (S1), 1268 (S2), 1250 (S3).
• Resistance: 1305 (R1), 1315 (R2), 1330 (R3).
WTI consolidates below the highs of April
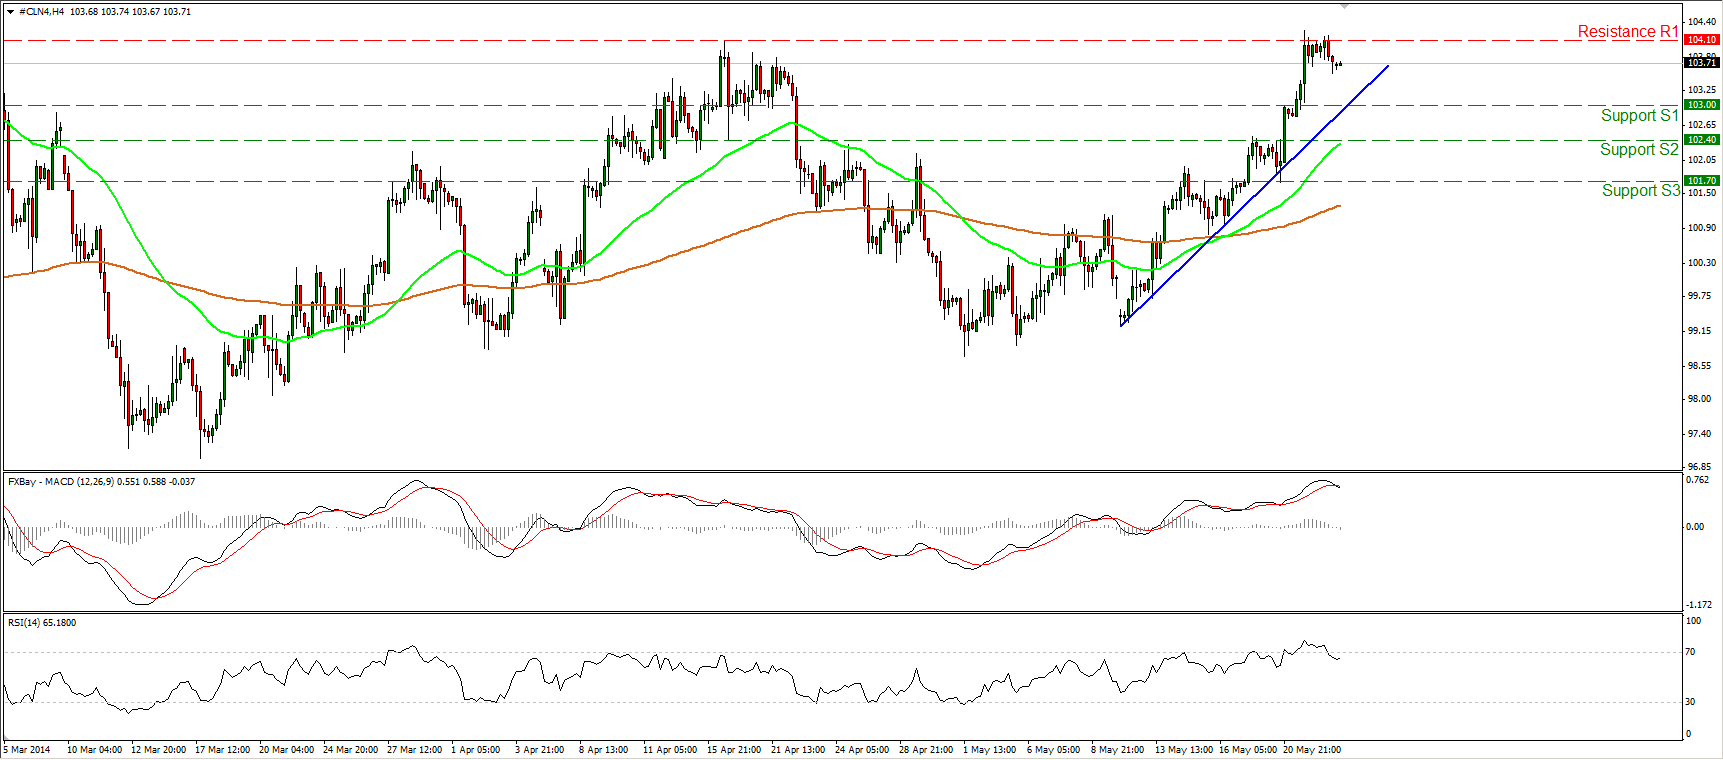
WTI moved in a consolidative mode remaining slightly below the highs of April at 104.10 (R1). If the longs are strong enough to push the price higher, I would expect them to overcome the aforementioned resistance and trigger extensions towards the critical barrier of 105.00 (R2). As long as WTI is printing higher highs and higher lows above both the moving averages, the uptrend remains in effect. However, the MACD, although in its bullish territory, crossed below its signal line, while the RSI exited overbought conditions and moved lower. Thus, some further consolidation or a pullback near the blue uptrend line cannot be ruled out.
• Support: 103.00 (S1), 102.40 (S2), 101.70 (S3).
• Resistance: 104.10 (R1), 105.00 (R2), 108.00 (R3).

