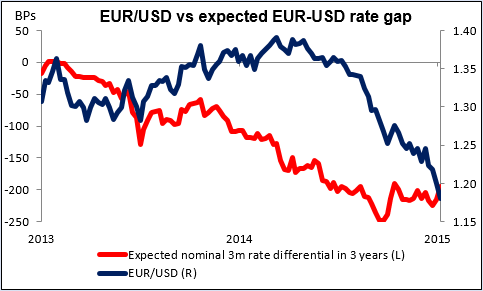
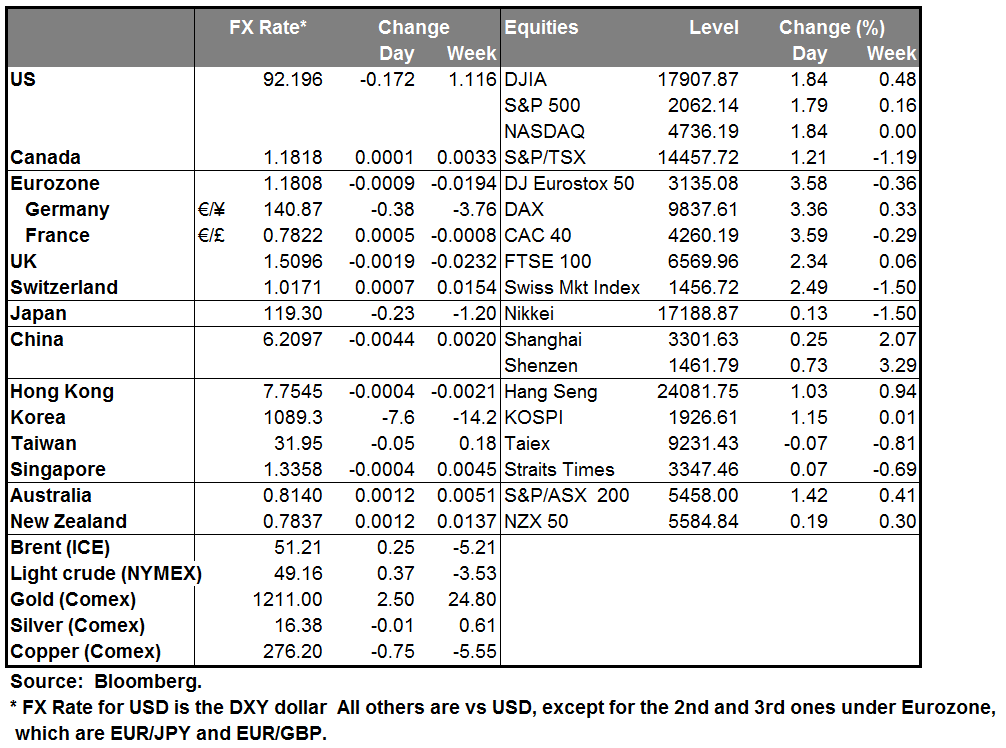
Back to where we started from According to Bloomberg, EUR/USD finished its first trading day in 1999 (4 January) at 1.1821. This morning we’re opening in Europe around 1.1807 – back to where we started from. Are we now headed back to the low of 0.8255 on 25 October 2000? At that time, Fed Funds were at the now-unimaginable level of 6.5% and the refi rate was 4.75%, a gap of 175 bps. That’s easily achievable.
The 3-month eurodollar and euribor futures are telling us that the spread will be around 200 bps in three years. Looking at yesterday’s European news – German factory orders and eurozone producer prices both falling more than expected in November – it looks like the ECB will have to make up for lost time.
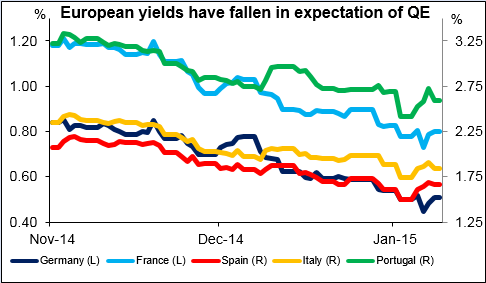
Unfortunately the ECB board appears to be still divided and might need more time to make up its mind. Yesterday ECB President Draghi released the text of a letter he wrote in reply to a member of the European Parliament about ECB policy. The letter repeated Draghi’s usual statements and in addition, specifically held out the possibility of buying sovereign bonds. Yet on the same day, ECB Board Member Benoit Coeure said that the eurozone hasn’t fallen into deflation yet and that it would be “too early to ask” for full-blown QE. So despite Draghi’s claims of unanimity on the board, it seems that there’s still disagreement. These comments appeared on the last day before the ECB board goes into blackout ahead of the Jan. 22nd meeting, which suggests that both men are trying to stake out their positions ahead of what looks like a crucial meeting.
Adding to this disagreement the legal difficulties in launching QE while there is no elected government in Greece, we have to consider what the market reaction might be if they cannot agree to start QE at next week’s meeting. I believe it would cause a huge sell-off in eurozone bonds and equities and a repatriation of capital, causing the euro to weaken further. On the other hand, the decision to launch QE is fairly well discounted so I don’t think that would have much impact on the markets.
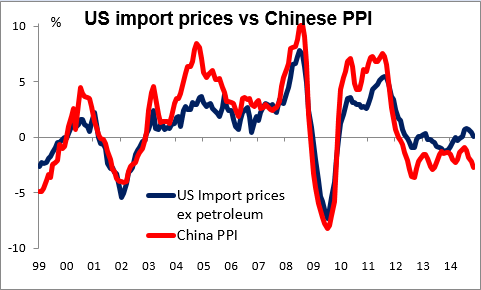
China’s CPI rose 1.5% yoy in December, as expected, a small increase from 1.4% yoy in November, but PPI fell 3.3% yoy, a substantially faster rate of deflation than -2.7% yoy the previous month. It seems to me only a matter of time before falling PPI feeds into falling CPI and Chinese deflation begins to affect other countries as well. That’s likely to keep interest rates low around the world and help to fuel the “currency wars” that result from the spillover of domestic monetary policy into the international arena.
New Zealand building permits were up 10% mom in November, beating October’s upwardly revised 9.8% rise. NZD was the second-best performing currency overnight as a result (NOK was #1). I think NZD will be the best-performing of the three commodity currencies as its commodity export basket is over half foodstuffs, and demand for food is less volatile than demand for energy or building materials.
Today’s highlights: During the European day, we get industrial production for November from Germany, France, UK and Sweden. The UK and French figures are expected to rebound from the previous month, while German and Sweden data are forecast to accelerate from October.
In Norway, the CPI for December is expected to rise, which could further strengthen NOK. The currency was the best-performing G10 currency over the last 24 hours despite Norway’s disappointing industrial production on Thursday, which indicates good demand for NOK. Nonetheless, given falling oil prices and the fact that the CPI is still below Norges Bank’s 2.5% inflation target, I would view any USD setback as a renewed buying opportunity.
In Canada, the unemployment rate for December is expected to have remained unchanged at 6.6%. However, the net change in employment is expected to show a rise after November’s decline, something that could prove CAD-positive
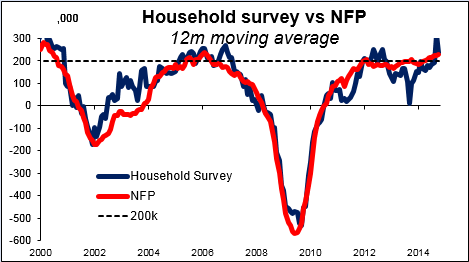
The highlight of the day will be the US non-farm payrolls for December. The forecast is for an increase in payrolls of 240k, down from the extraordinarily high 321k in November. Despite the expectation of a slowdown in December payrolls, it still will show that the US economy has added at least 200k jobs for 11 consecutive months and could result the biggest annual gain in employment since 1999. At the same time the unemployment rate is forecast to have declined to 5.7% from 5.8%, while average hourly earnings are expected to accelerate on a yoy basis. Such a strong employment report is consistent with a firming labor market and could add to USD strength. Wholesale inventories for November are also to be released.
We have two Fed speakers on Friday’s agenda: Chicago Fed President Charles Evans and Richmond Fed President Jeffrey Lacker.
The Market
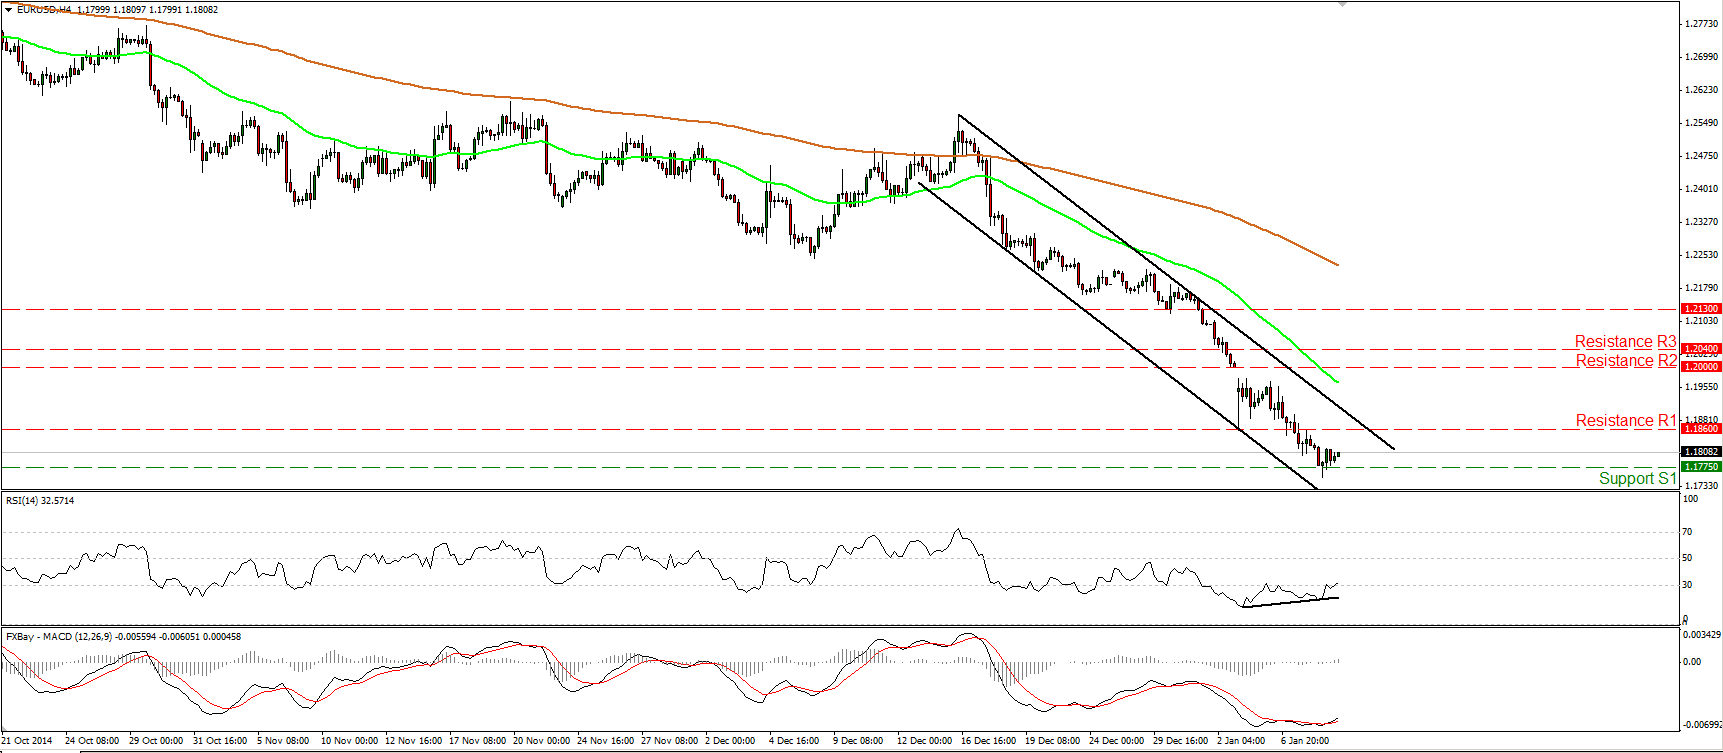
EUR/USD touches our support of 1.1775
EUR/USD continued its slide on Thursday to find support marginally below our barrier of 1.1775 (S1). Today, we get the US non-farm payrolls for December. Even if the figure isn’t up to November’s stunning print, the report is still expected to show that the US economy has added at least 200k jobs for 11 consecutive months. This could encourage the bears to push the rate below the support line of 1.1775 (S1) and perhaps target the next one at 1.1700 (S2), determined by the low of the 8th of December 2005. But, the positive divergence between the RSI and the price action shows decelerating downside momentum and therefore it is possible that we may see a minor bounce before the next leg down. Nonetheless, the rate is still trading within the black downside channel taken from back at the high of the 16th of December, and this keeps the short-term bias to the downside. As for the bigger picture, the broader downtrend is still in force.
• Support: 1.1775 (S1), 1.1700 (S2), 1.1635 (S3)
• Resistance: 1.1860 (R1), 1.2000 (R2), 1.2040 (R3)
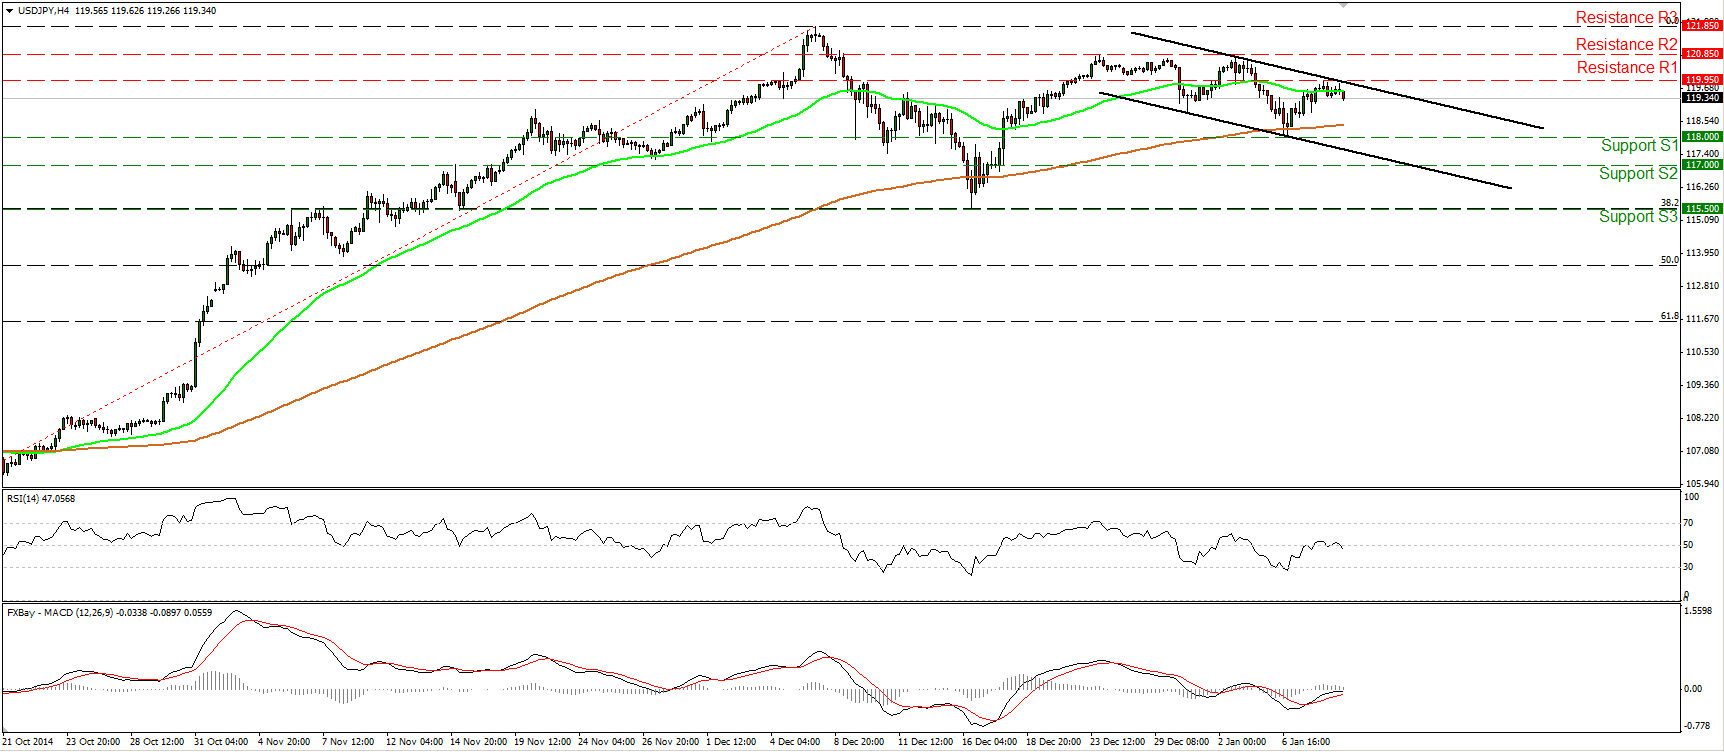
USD/JPY capped by the 119.95 obstacle
USD/JPY raced higher yesterday, but the up leg was halted by the 119.95 (R1) obstacle. Today, during the Asian morning the pair started sliding, indicating the inability of the bulls to overcome the aforementioned resistance hurdle. Maybe they are waiting for the US employment data later in the day. If the data come in strong, we may see a break above the 119.95 (R1) line and perhaps extensions towards the next one at 120.85 (R2). However, our short-term oscillators support further pullback for now, at least until the time of the report. The RSI fell below its 50 line and is pointing down, while the MACD shows signs of topping marginally below its zero line, and could fall below its trigger soon.
• Support: 118.00 (S1), 117.00 (S2), 115.50 (S3)
• Resistance: 119.95 (R1), 120.85 (R2), 121.85 (R3)
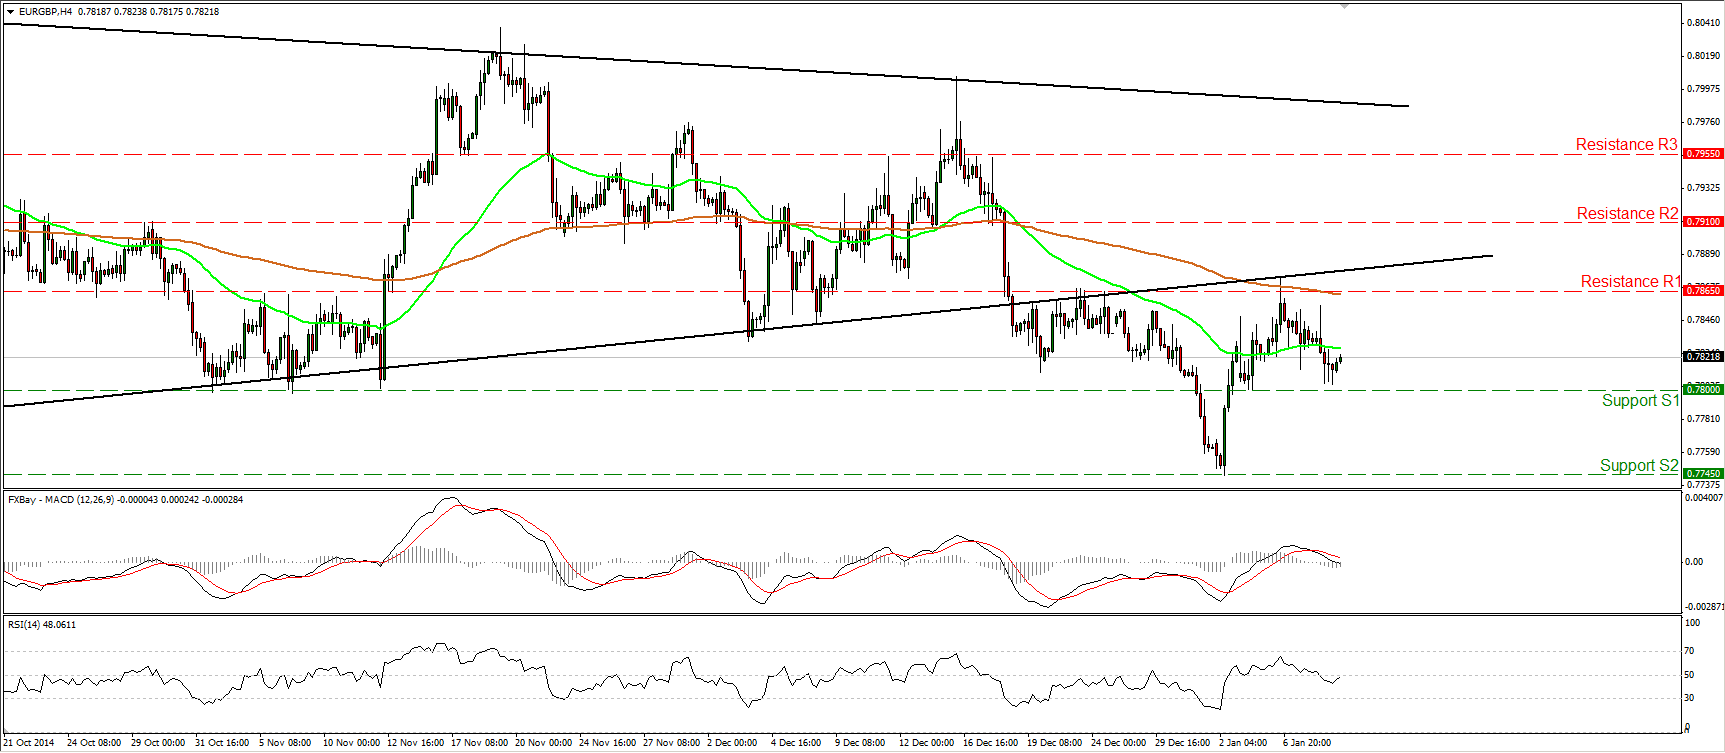
EUR/GBP bears are stopped slightly above 0.7800
EUR/GBP kept sliding on Thursday and hit support marginally above the 0.7800 (S1) barrier. Having in mind that on the 6th of January the rate tested as resistance the lower bound of a triangle formation that had been containing the price action since September, I would expect a possible fall below the 0.7800 (S1) line, to turn the bias back to the downside and pull the trigger for another test near the support of 0.7745 (S2), defined by the low of the 2nd of January. In the bigger picture, the downside exit of the triangle pattern signaled the continuation of the longer-term downtrend in my view, thus I will hold the view that the overall outlook stays negative.
• Support: 0.7800 (S1), 0.7745 (S2), 0.7700 (S3)
• Resistance: 0.7865 (R1), 0.7910 (R2), 0.7955 (R3)
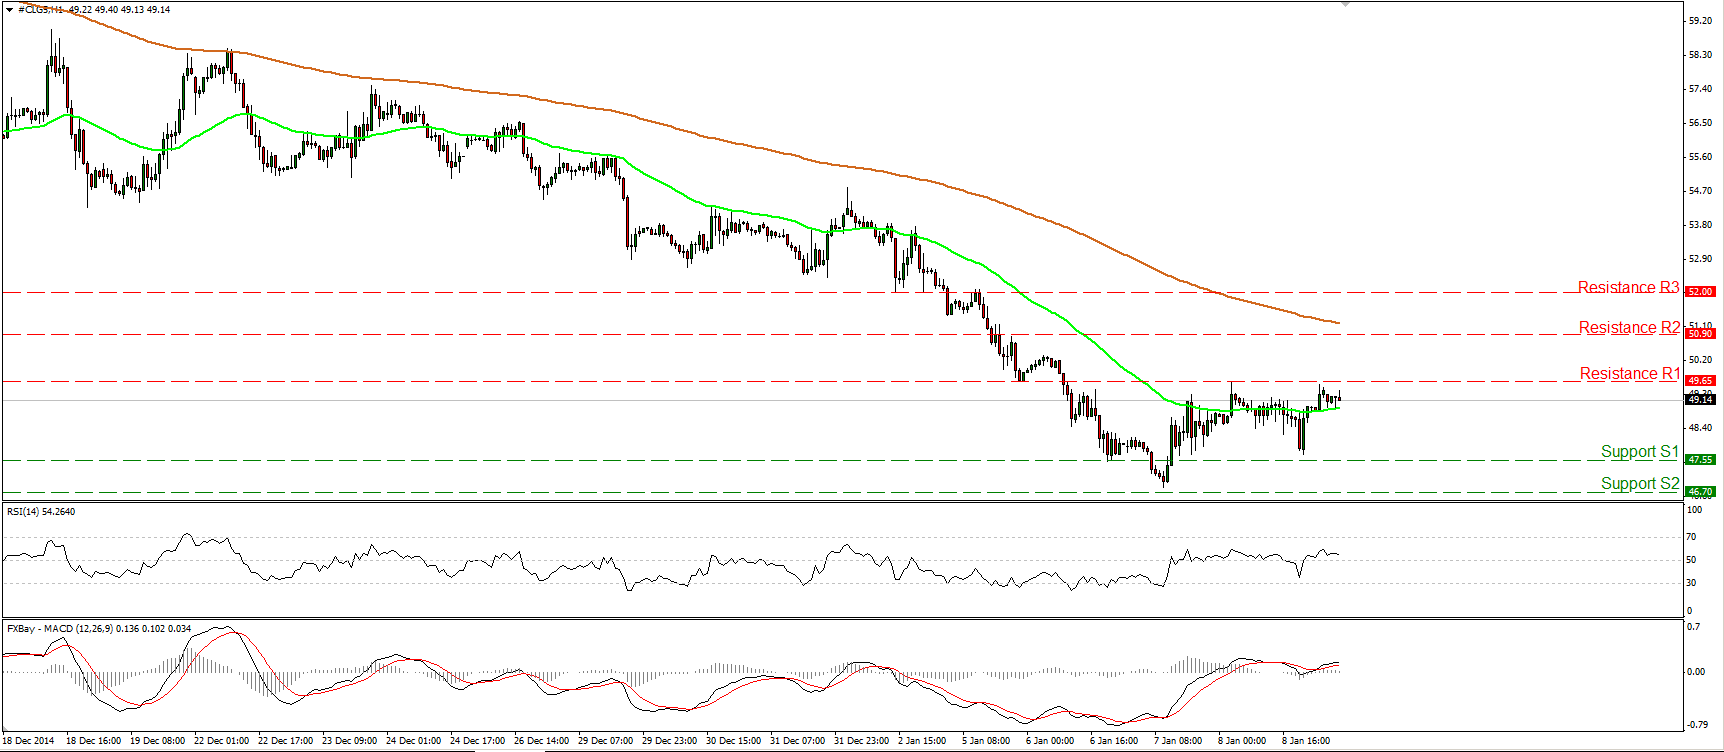
WTI hits again the resistance of 49.65
WTI declined on Thursday, but after triggering some buy orders slightly above our support hurdle of 47.55 (S1), it rebounded to hit again our resistance barrier of 49.65 (R1). Although yesterday’s up leg may continue a bit higher, on the daily chart WTI is still printing lower peaks and lower troughs below both the 50- and the 200-day moving averages, which keeps the overall path to the downside. Therefore, I would expect any possible extensions of the current rebound to be short lived. Taking a look at our daily momentum indicators, there is positive divergence between the 14-day RSI and the price action, which gives me another reason to be cautious that the upside corrective wave may continue for a while. However, I would not bet on that and I would prefer to wait for actionable signals that the bears are back in control and go with the overall downtrend.
• Support: 47.55 (S1), 46.70 (S2), 45.00 (S3)
• Resistance: 49.65 (R1), 50.90 (R2), 52.00 (R3)
Gold rebounds from 1205
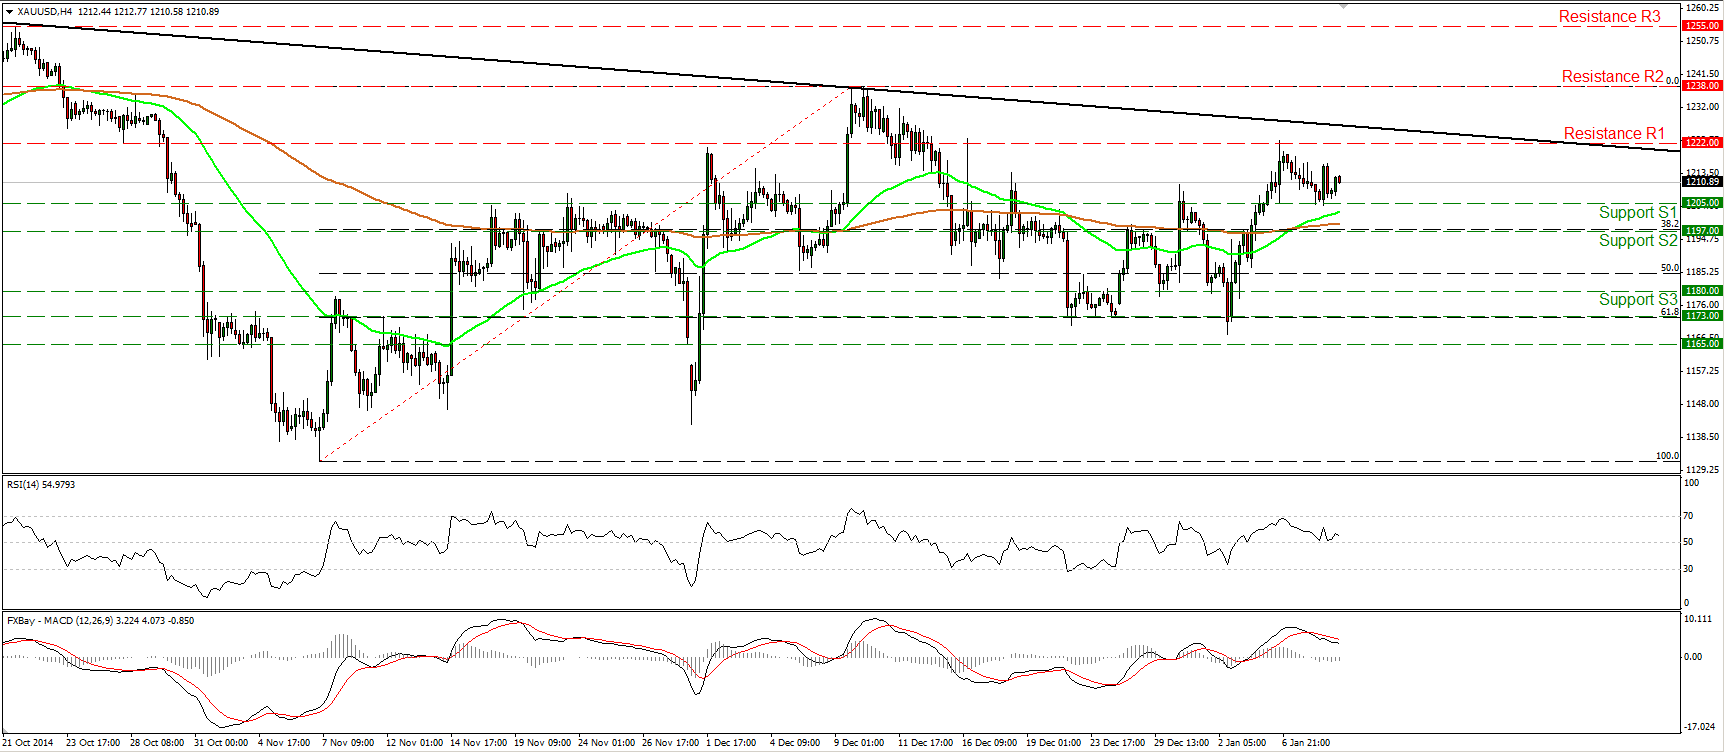
Gold continued pulling back for a while yesterday, but after hitting the 1205 (S1) line, it rebounded to trade near 1210. Since this rebound signals a higher low on the 4-hour chart, I would hold the view that the near-term picture of the precious metal remains mildly to the upside. If the bulls are strong enough to drive the battle higher and overcome the resistance zone of 1222 (R1), I would expect extensions towards the 1238 (R2) obstacle, marked by the highs of the 9th and 10th of December. On the daily chart, I see that a possible inverted head and shoulders pattern is probably being formed but not completed yet. If the pattern is completed, this could have larger bullish implications and perhaps encourage the bulls to drive the battle even above 1300.
• Support: 1205 (S1), 1197 (S2), 1180 (S3)
• Resistance: 1222 (R1), 1238 (R2), 1255 (R3)

