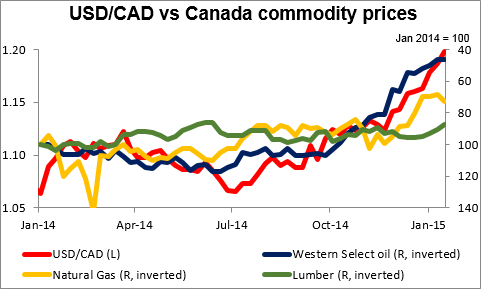
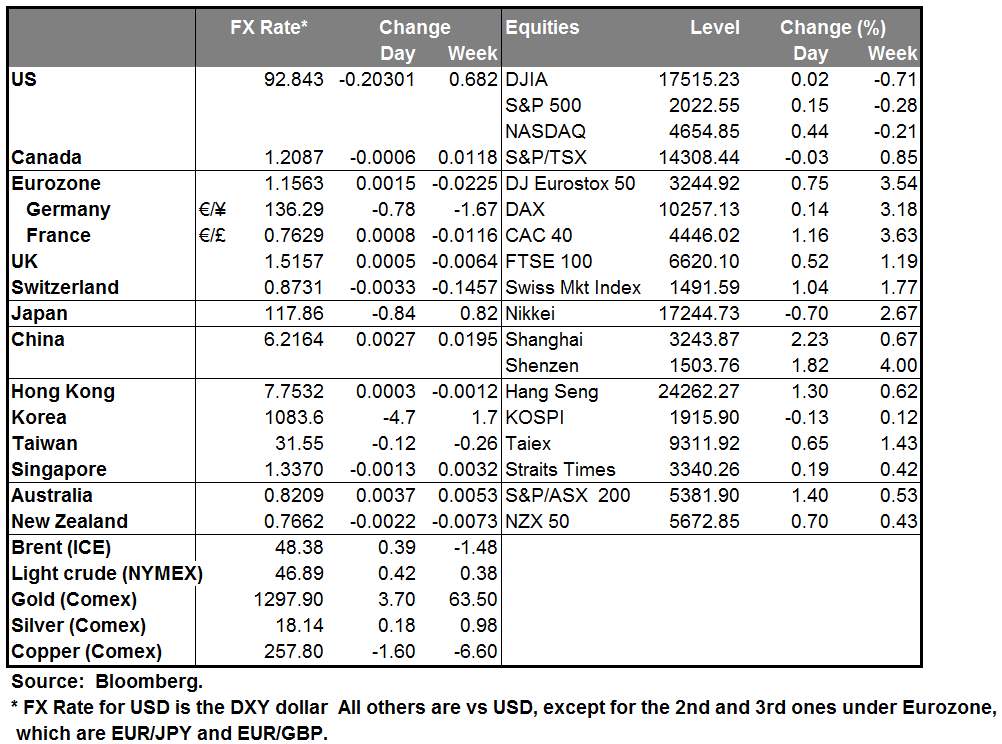
USD/CAD breaks through 1.20 as sales disappoint, commodity prices fall USD/CAD finally broke through the 1.20 barrier overnight as manufacturing sales disappointed oil and prices of Canada’s commodity exports fell further. Manufacturing sales were down 1.4% mom in November, a sharper decline than -0.6% in October and double what the market had been expecting. Sales declined in 16 of 21 industries, led by a 5.9% drop in motor vehicles and parts. Given that manufacturing accounts for 10.8% of GDP, this decline will dampen GDP growth. In addition, the price of Canada’s major export commodities continue to decline. Not only oil, but also natural gas and lumber prices are falling. Lumber is down 11% from its recent peak in early December, while natural gas was down 9.5% just yesterday and is off some 35% from its November highs. This sets up a dovish background for the Bank of Canada’s meeting today (see below). The market is already pricing in some small (7 bps) chance of easing by the end of the year, which is in contrast to the tightening expected in the US. I believe USD/CAD can move still higher.
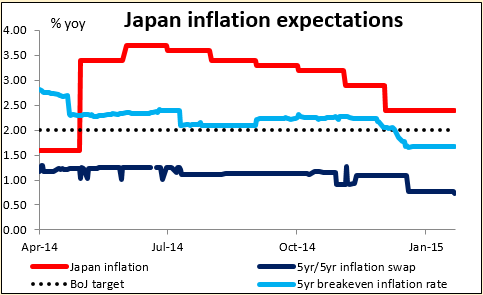
The Bank of Japan cut its inflation forecast for the coming fiscal year beginning in April to 1% from around 2%, an admission that they are not going to hit their 2% target that they were supposed to achieve by then. They still insist however that they will hit the target by the following FY. This increases the likelihood of further stimulus at some point down the road. On the other hand, maybe it means they are going to give up on trying to create inflation, at least for the time being. Kozo Yamamoto, a leading expert on monetary policy in the ruling Liberal Democratic Party, said recently that the effect of the BoJ’s monetary easing last October should start boosting the economy by around this summer. "What more can the BOJ do? I think the central bank can hold off on action and take a wait-and-see stance for the time being," Yamamoto said in a recent Reuters interview. The 5yr/5yr inflation swap in Japan is now at 0.75% while the 5-year breakeven inflation rate is 1.68%, showing that the market does not believe the BoJ will hit its target in the next five years. As a result, I think the market is likely to expect further easing by the BoJ and that should keep JPY under pressure.
The big question then is whether the BoJ’s manifest failure to produce inflation so far will convince the Board to follow the Swiss National Bank’s lead and give up its attempt to control the market. That would be a major, major shock to the global financial system. Japan is famous as the place where officials do everything they can to avoid the dreaded “confusion in the marketplace,” so I would not expect them to take such a radical step. But then again, Switzerland isn’t known as a hotbed of experimental monetary policy, either. ‘
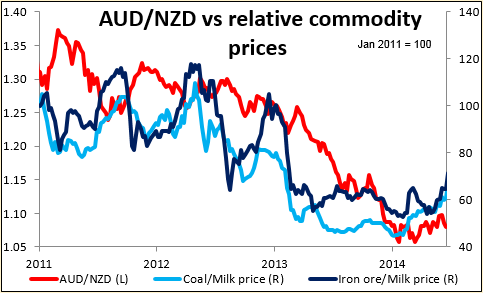
NZD fell sharply as inflation dropped Prices fell 0.2% qoq in 4Q, bringing the yoy rate of inflation down to 0.8% from 1.0% previously. However I still feel more optimistic about NZD than about the other commodity currencies. Yesterday’s milk auction came with a higher price for the second auction in a row. This is in sharp contrast to the performance of industrial commodities recently. NZD/USD may be headed lower, but so too is AUD/NZD, in my view.
Today’s highlights: Today we get the minutes from the latest BoE meeting. The focus will be on the number and the names of the dissenters, especially following the fall in December’s CPI rate below 1% and the comments by the BoE Gov. Carney that lower oil prices are positive for the UK. . Kristin Forbes, who is one of the Monetary Policy Committee's new members, is viewed to be on the “hawkish” end of the scale given her views on the existing slack in the labor market. Therefore, we wouldn’t be surprised if she joins the other two MPC members in voting for a rate hike anytime soon. On top of that, the UK unemployment rate is expected to have declined to 5.9% in November from 6.0%, while average weekly earnings are anticipated to accelerate, suggesting less slack in the labor market. Overall this could be GBP-supportive and the better fundamentals compared to eurozone could push EUR/GBP further down.
In the US, we get housing starts and building permits, both for December. Both figures are expected to rise keeping the overall trend consistent with an improving housing market. This could signal that the housing market supports what appears to be growing strength in the broader economy and keep the USD supported.
In Canada, the Bank of Canada is expected to keep its benchmark interest rate unchanged. The recent collapse in oil prices is likely to put pressure on the Bank to revise down its 2015 GDP growth and inflation forecasts, as Canada’s Western Select oil was trading around USD 80/bbl when the BoC last did its projections and it currently trades around USD 33/bbl. The extent of the revision will depend on what the Bank assumes for oil prices. This is likely to keep the BoC on hold for longer than they would otherwise. There may even be some discussion of a rate cut. This, along with expectations that the inflation rate for December will slow further when it’s announced on Friday, are likely to leave CAD vulnerable, in our view.
The World Economic Forum will begin in Davos.
The Market
EUR/USD somewhat lower
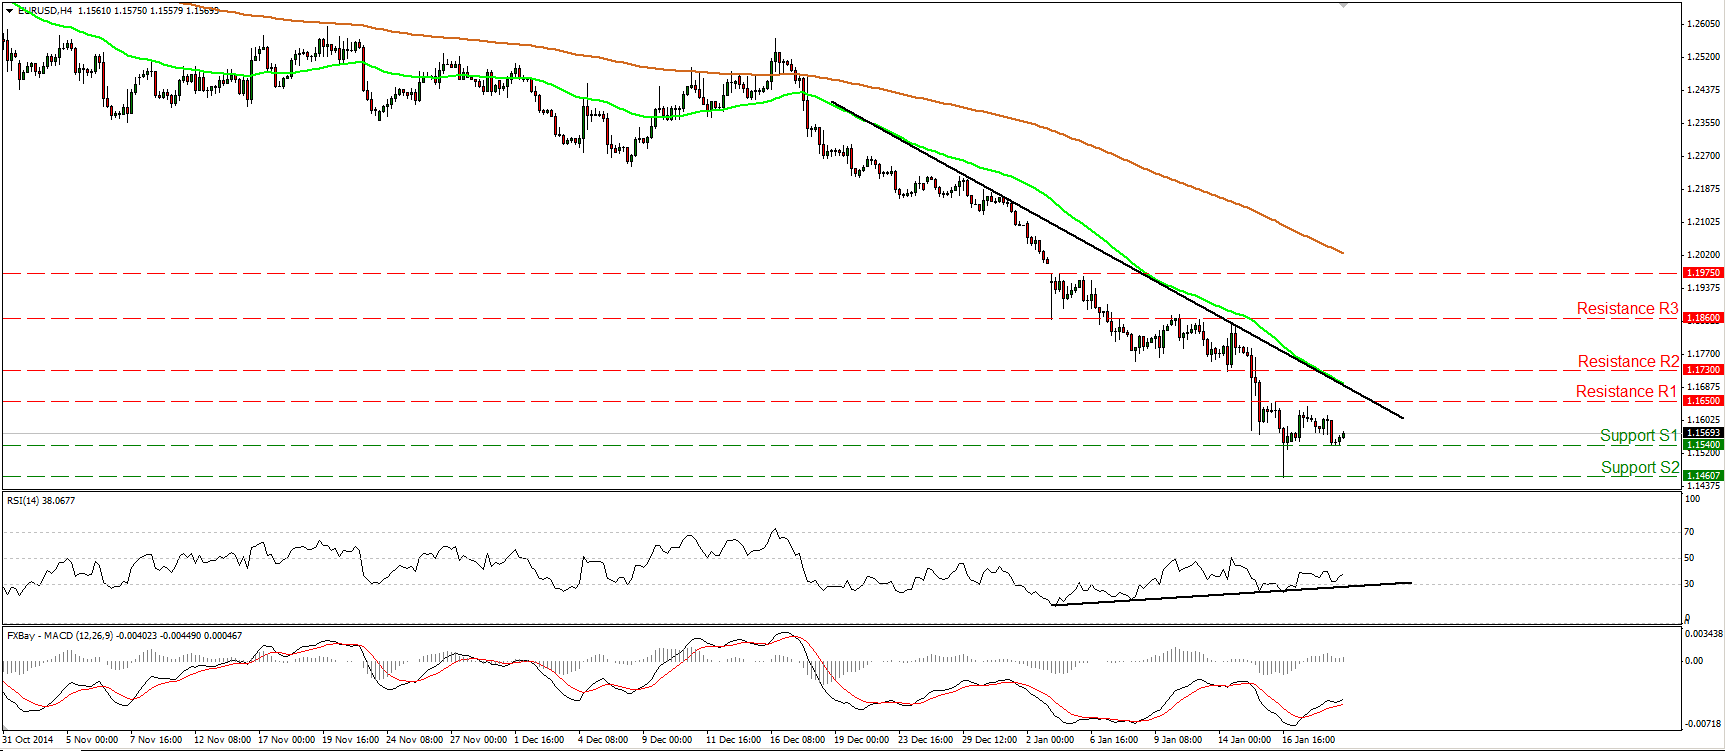
EUR/USD traded somewhat lower on Tuesday, staying between the resistance line of 1.1650 (R1) and the support of 1.1540 (S1). In my view, the short-term picture remains negative, but given the positive divergence between the RSI and the price action, I would prefer to wait for more actionable signs that the bears are back in control. I believe that a decisive move below the 1.1540 (S1) barrier is likely to aim for the 1.1460 (S2) hurdle, marked by Friday’s low. As for the overall trend, on the daily chart, the price structure still suggests a downtrend. The pair is forming lower peaks and lower troughs below both the 50- and the 200-day moving averages.
• Support: 1.1540 (S1), 1.1460 (S2), 1.1370 (S3).
• Resistance: 1.1650 (R1), 1.1730 (R2), 1.1860 (R3).
NZD/USD collapses on New Zealand’s CPI data
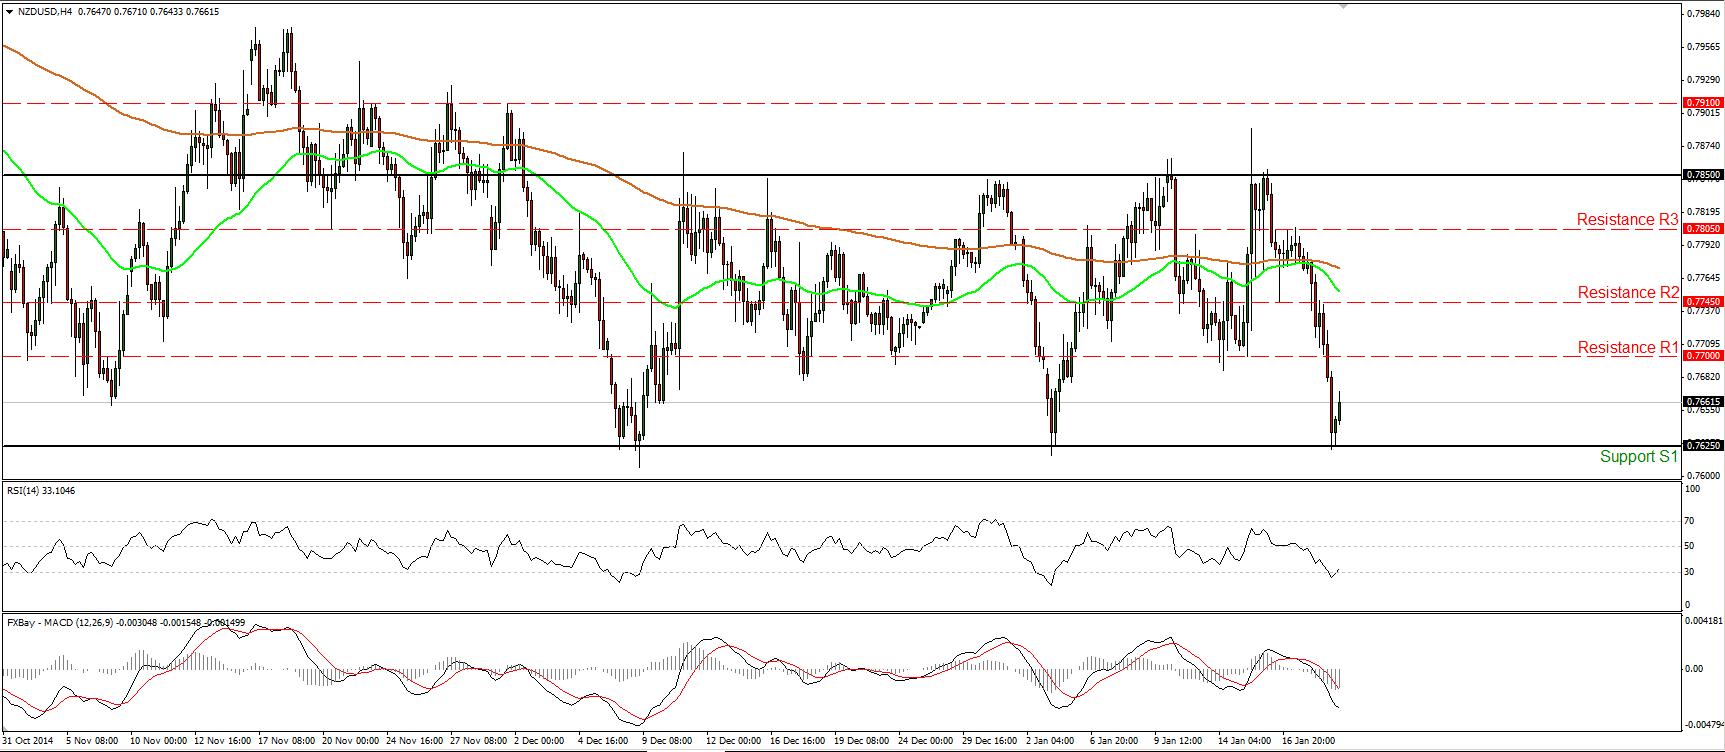
NZD/USD collapsed after New Zealand’s CPI slowed by more than anticipated in Q4. The rate dipped below the support (turned into resistance) barrier of 0.7700 (R1) to reach the 0.7625 line (S1), the lower boundary of the trading range it’s been oscillating in since the beginnings of December. Given the trendless market action and bearing in mind the reaction of the pair near 0.7625 (S1), I would expect the forthcoming wave to be to the upside, perhaps to challenge the 0.7700 (R1) line as a resistance this time. On the daily chart, our daily momentum studies gyrate around their neutral lines, confirming the near-term trendless mode of this pair.
• Support: 0.7625 (S1), 0.7500 (S2), 0.7500 (S3).
• Resistance: 0.7700 (R1), 0.7745 (R2), 0.7805 (R3).
GBP/USD firms up ahead of BoE minutes and UK employment report
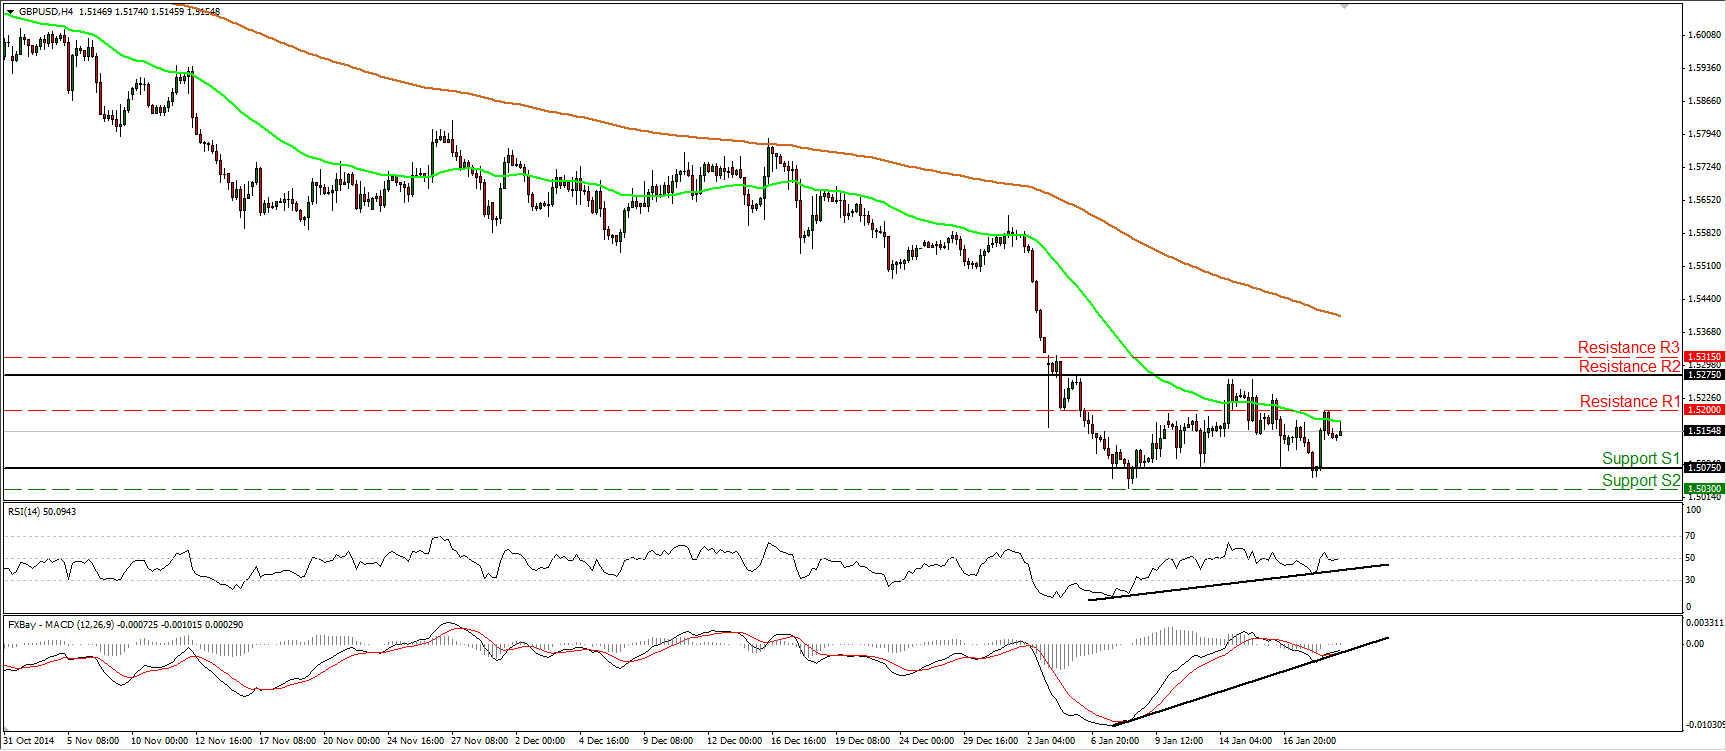
GBP/USD raced higher on Tuesday after finding support near the 1.5075 (S1) barrier. Today, the UK unemployment report for November is forecast to have declined, while average weekly earnings are estimated to have accelerated. We also get the BoE meeting minutes, where there is a possibility that Kristin Forbes, a new member, joined the other two dissenters. Therefore, having in mind these releases, I would expect the rate to move higher today. A break above the 1.5200 (R1) resistance is likely aim for the 1.5275 line. Even though I see a bullish forthcoming wave, the short-term outlook stays neutral in my view. The rate has been in a trendless mode since the 8th of January. As for the broader trend, I maintain the stance that as long as Cable is trading below the 80-day exponential moving average, the overall trend stays negative. But given the positive divergence between the daily oscillators and the price action, I would prefer to wait for a clear close below 1.5000 (S3), before trusting again the overall down path.
• Support: 1.5075 (S1), 1.5030 (S2), 1.5000 (S3).
• Resistance: 1.5200 (R1), 1.5275 (R2), 1.5315 (R3).
Gold ready to challenge 1300
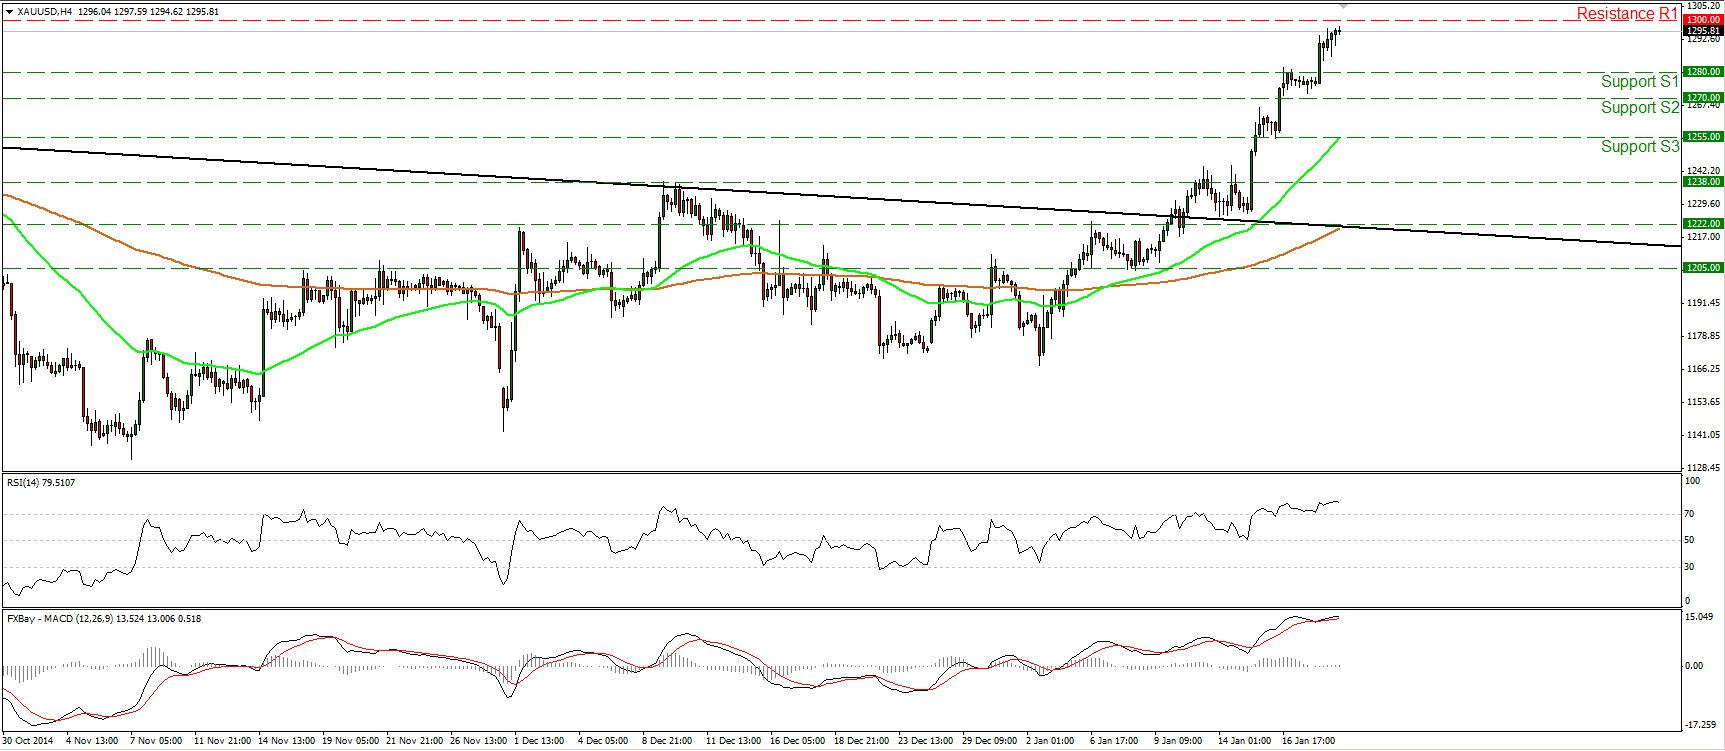
Gold raced higher on Tuesday and today during the early European morning, it appears ready to challenge the round figure of 1300 (R1). A clear and decisive break above that key area is likely to extend the bullish wave of the precious metal and perhaps challenge our next obstacle at 1320 (R2), marked by the high of the 14th of August. The RSI stuck within its overbought territory, while the MACD, already at extreme positive levels, rebounded from near its trigger line. These momentum signs confirm the accelerating upside momentum of the metal. On the daily chart, gold shot up after completing an inverted head and shoulders formation on the 12th of January. The price objective of the formation stands around 1340 (R3).
• Support: 1270 (S1), 1255 (S2), 1238 (S3).
• Resistance: 1300 (R1), 1320 (R2), 1340 (R3).
WTI testing the support of 45.90
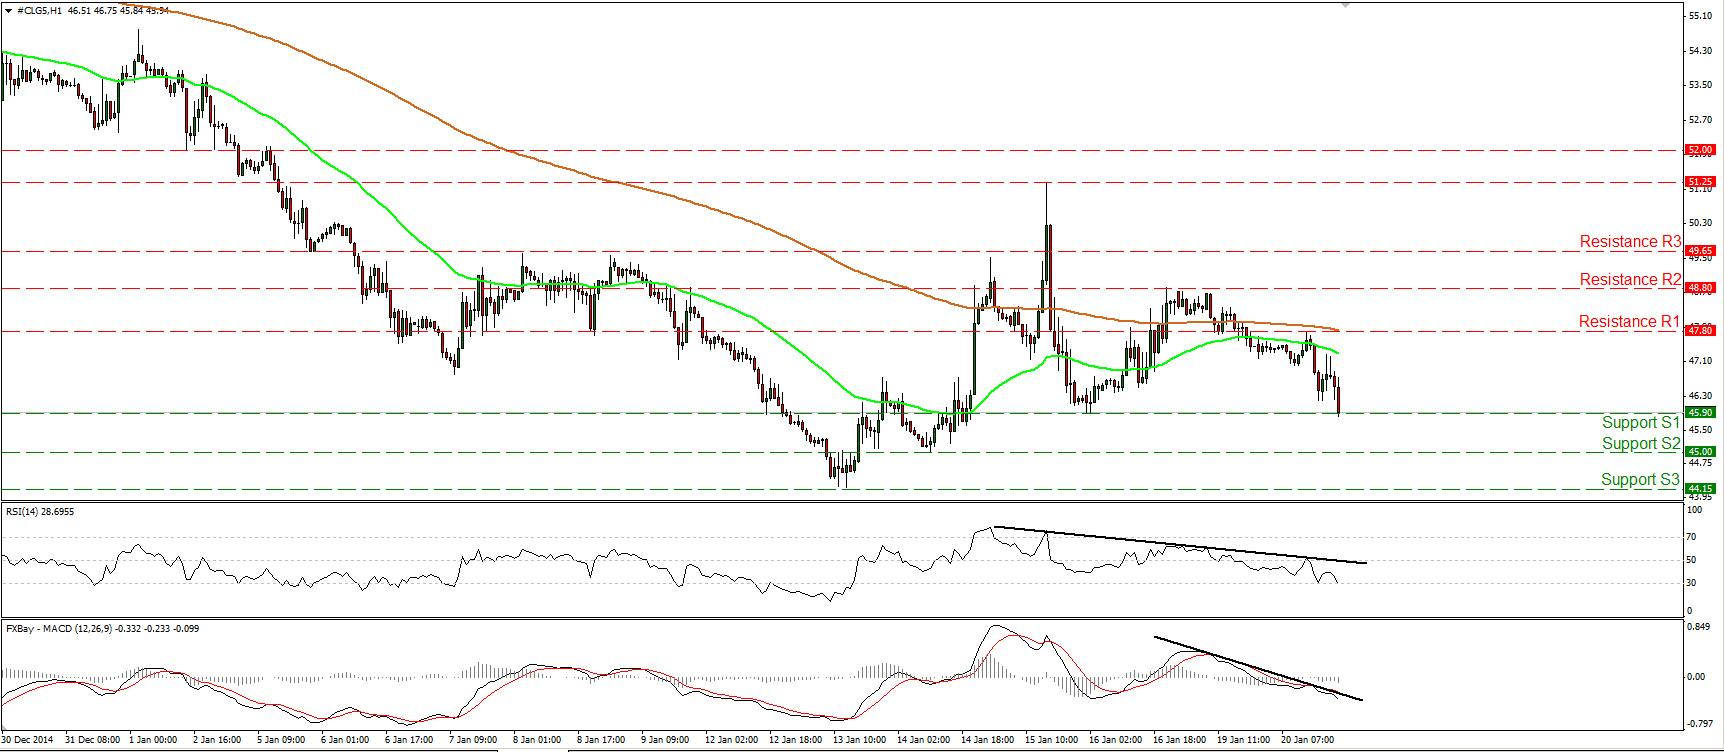
WTI continued its slide yesterday and today it is testing the support barrier of 45.90 (S1), defined by the low Friday. In my opinion, the intraday bias is back to the downside, and as a result, I would expect a move below 45.90 (S1) to target the psychological barrier of 45.00 (S2), also marked by the low of the 14th of January. Our momentum studies indicate strong downside momentum. The RSI declined and now appears ready to enter its oversold territory, while the MACD stands below both its trigger and signal lines, pointing south. On the daily chart, WTI is still printing lower peaks and lower troughs below both the 50- and the 200-day moving averages, and this keeps the overall downtrend intact. However, since there is still positive divergence between the daily oscillators and the price action, I would prefer to wait for the momentum indicators to confirm the price action before getting again confident about the overall down path.
• Support: 45.90 (S1), 45.00 (S2), 44.15 (S3).
• Resistance: 47.80 (R1), 48.80 (R2), 49.65(R3).

