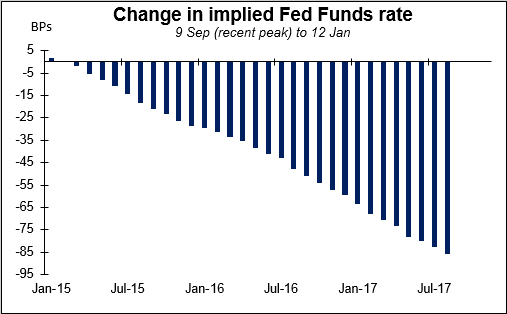
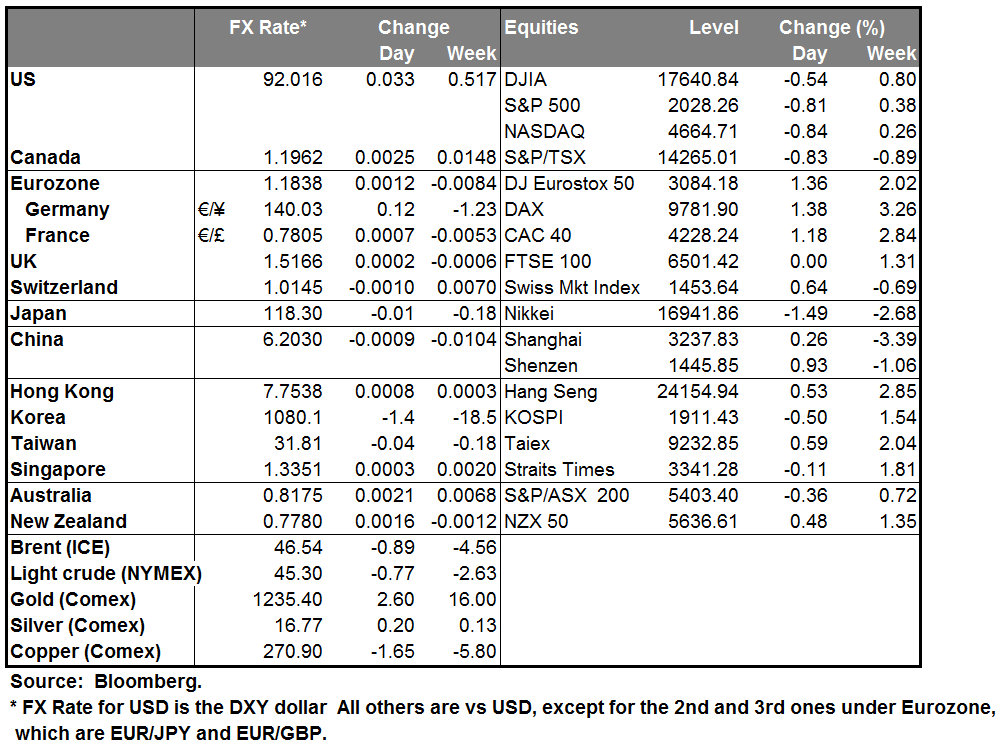
Dollar recovers but Fed expectations don’t The dollar generally recovered yesterday. It held steady against the pound and gained against all other G10 currencies even while the market continued to pare back its expectations for Fed tightening and US bond yields fell. The contradiction between the dollar’s performance and that of the interest rate market is a bit difficult to understand, but the key may be in oil: oil prices continued to collapse, leading the commodity-related currencies lower. The main theme in the market seems to be concerns about deflation. Copper hit a five-year low. In a situation of global deflation, all central banks will be hit with similar constraints, but the relative movement will remain the same: the US will be the first to tighten, even if the date is pared back. So some measure of dollar strength is compatible with diminishing Fed rate expectations as long as they go along with diminishing expectations for other central banks, too.
Politics is starting to impact the pound Polls in the UK about the election in May are showing an unpredictable result, which is likely to weaken the pound. The polls are contradictory: one poll released Monday had the Conservative Party ahead of Labor by 6 percentage points (34%-28%), another poll had Labour leading by 5 ppt (37%-32%). It does seem that Labour’s lead is diminishing, but the issue is whether either party will be able to get a large enough majority to govern by themselves. Otherwise there will be difficult coalition discussions and the result is likely to be a weak, fractious coalition or even a minority government. Either result would be a negative for the pound. Politics is an increasing risk for sterling.
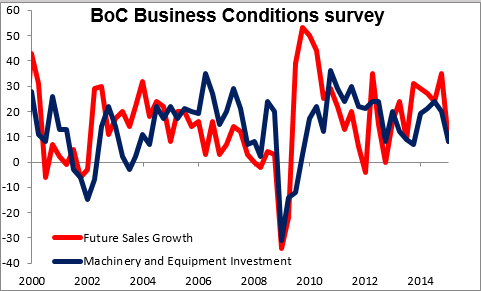
CAD is a major victim of weaker oil prices Weak Canadian data out yesterday caused the market to price in some modest easing by the Bank of Canada, which pushed USD/CAD further towards 1.20. Canada’s Q4 business outlook DI for future sales optimism fell to 8 from 35 (expected: 29), while below-target inflation expectations rose. I expect CAD to be one of the weaker currencies nowadays. Although it could benefit from a relatively strong US economy, its dependence on oil (24% of exports) makes it the purest energy play in the G10. USD/CAD’s correlation with oil prices is even (slightly) higher than USD/NOK’s.
Japan’s current account surplus was higher than expected in November. On a seasonally adjusted basis it was basically stable from the previous month instead of falling by around one-third, as expected. The trade account continues to be in deficit. What’s happening seems to be that as the yen weakens, the yen value of income in other currencies rises and the income account rises. This effect may wane over time however as bonds mature and are replaced with new bonds carrying lower interest rates.
China’s trade surplus fell in December, in line with forecasts.
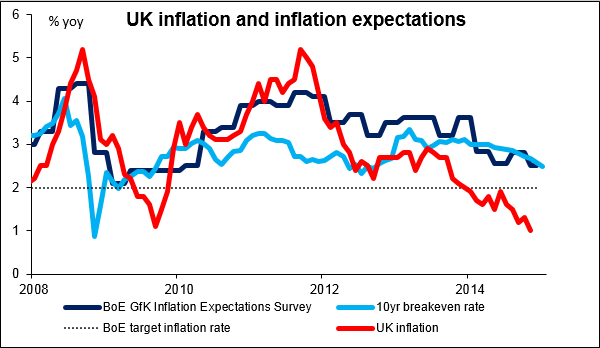
Today’s highlights: The UK CPI for December is expected to fall below 1%, driven mainly by lower energy prices. The decline confirms the warning in the BoE’s November inflation report that inflation is likely to fall below 1% within 6 months. This could push further back the expectations for tightening and add to the negative sentiment towards GBP.
Sweden’s CPI is expected to show that the country fell deeper into deflation. The minutes of the Riksbank’s December policy meeting confirmed that unconventional measures are being prepared and could be used if prices fail to recover. Given the further decline in consumer prices, this could prompt Riksbank to take further action at the February meeting. This is likely to increase selling pressure towards SEK. The country’s PES unemployment rate for December is also coming out.
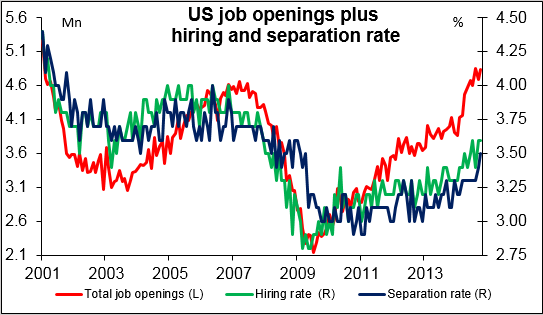
In the US, only secondary importance data are coming out. The NFIB small business optimism for December is expected to have increased fractionally to its highest level since February 2007. While this indicator is not particularly market-affecting, it’s well worth watching because of the Fed’s emphasis on the labor market. Small businesses employ the majority of people in the US. The Job Opening and Labor Turnover Survey (JOLTS) report for November is forecast to show that the number of job openings has increased marginally. Following last week’s strong nonfarm payroll figure, this is likely to keep the dollar supported. Investors also pay attention to the number of people quitting jobs, because that’s an indication of confidence in the labor market – people normally don’t quit their job unless they’re confident they can get another one.
As for the speakers ECB Governing Council member Ewald Nowotny speaks again. Yesterday he said the ECB shouldn’t wait too long to fight deflation. “It is important that one takes deflation risks seriously and addresses them,” he said.
The Market
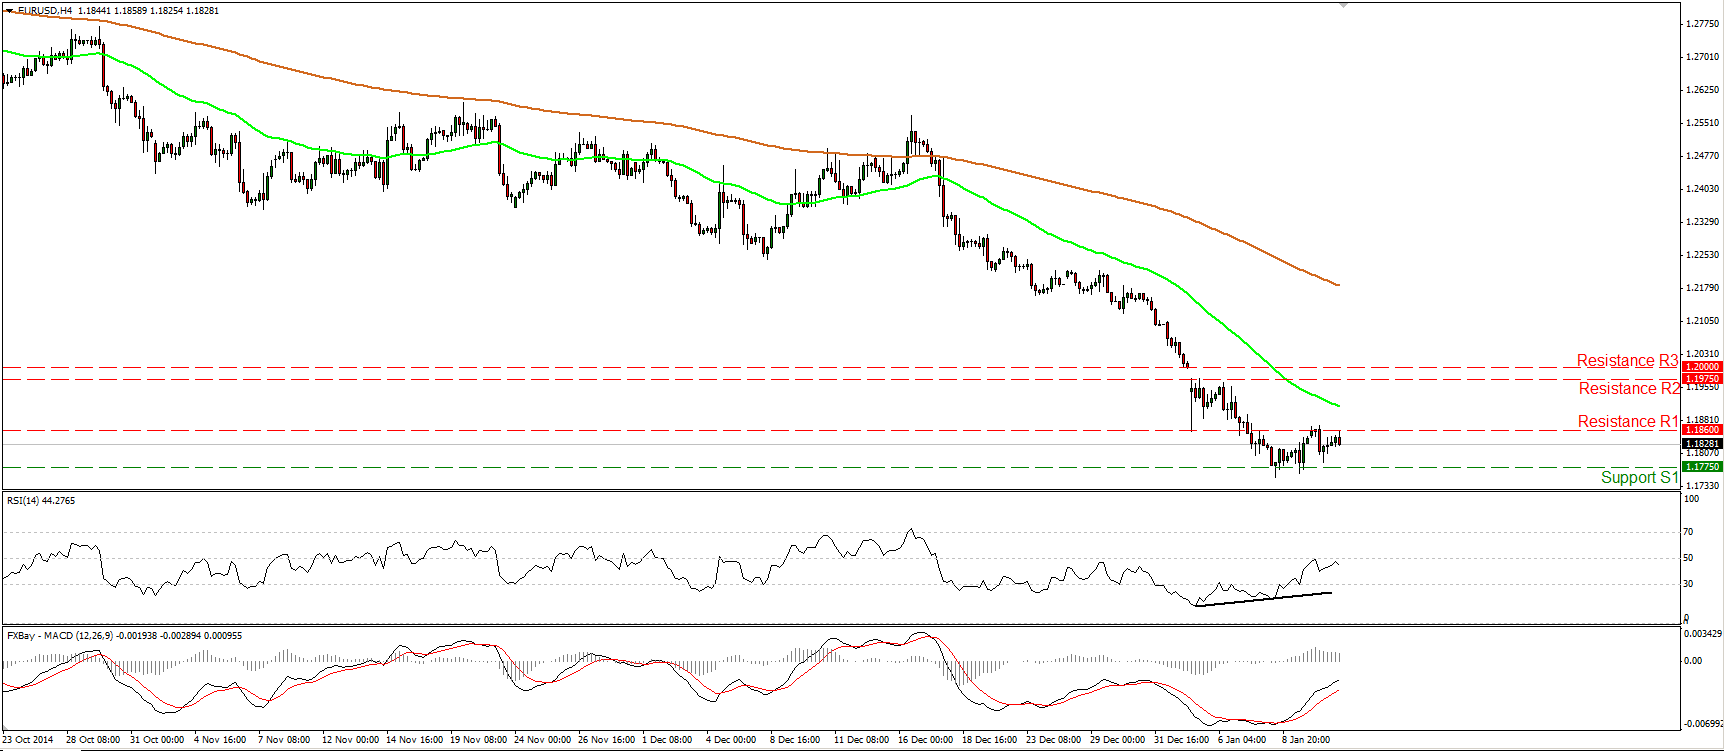
EUR/USD touches again the 1.860 line
EUR/USD moved somewhat lower yesterday, but after finding support marginally above our 1.1775 (S1) line, it rebounded to touch again the resistance line of 1.1860 (R1). Given that there is still positive divergence between the RSI and the price action and that both our momentum indicators continued to race higher, I see the possibility for a move above 1.1860 (R1), perhaps for a test of the resistance line of 1.1975 (R2). Nevertheless, given that the longer-term trend is to the downside, I would treat any possible bullish waves as corrective moves and wait for more actionable signs that the bears are back in control. I still believe that a decisive move below the 1.1775 (S1) zone is likely to pave the way towards the next support at 1.1700 (S2), determined by the low of the 8th of December 2005.
• Support: 1.1775 (S1), 1.1700 (S2), 1.1635 (S3)
• Resistance: 1.1860 (R1), 1.1975 (R2), 1.2000 (R3)
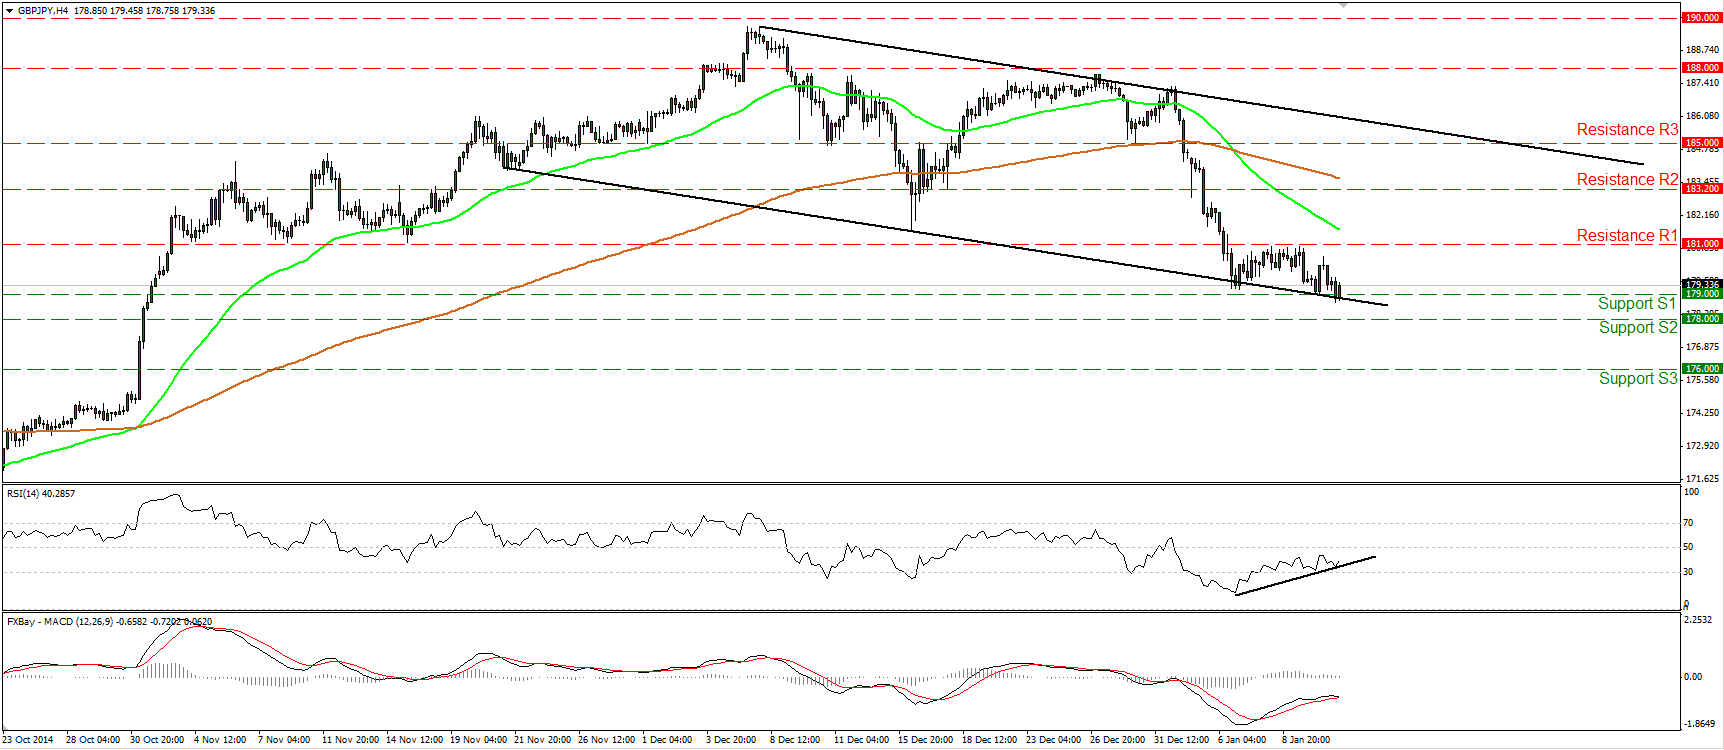
GBP/JPY finds support near 179.00
GBP/JPY moved in a consolidative manner, staying near the 179.00 (S1) line and the lower bound of the black downside channel. Today, the UK CPI is expected to fall below 1% yoy in December. Falling inflation, combined with the inability of the bulls to push the rate higher after hitting support at the lower line of the channel, could be the catalyst for a breakdown of the channel. A move below the 179.00 (S1) hurdle is likely to pull the trigger for the next support at 178.00 (S2). On the daily chart, the dip below the 181.00 (R1) signaled the completion of a failure swing top, something that gives me another reason to expect a weaker rate in the near future.
• Support: 179.00 (S1), 178.00 (S2), 176.00 (S3)
• Resistance: 181.00 (R1), 183.20 (R2), 185.00 (R3)
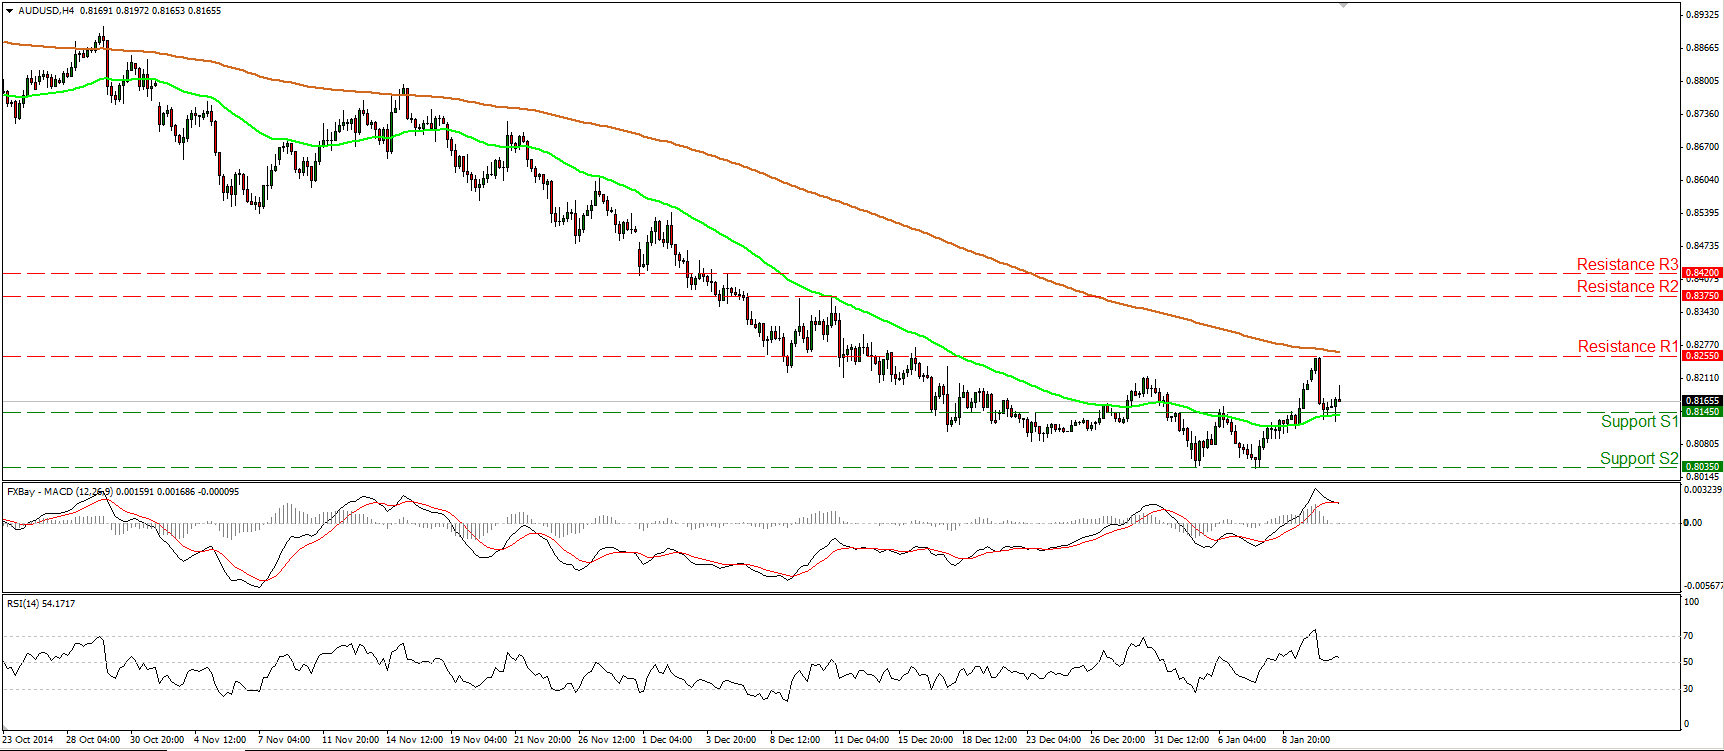
AUD/USD rebounds somewhat from 0.8145
AUD/USD fell sharply yesterday after finding selling orders at 0.8255 (R1). Nevertheless, the fall was halted near the 0.8145 (S1) area and subsequently the rate rebounded somewhat. Even though I still see a longer-term downtrend on the daily chart, having in mind that the possibility for a higher low is still there, I would consider the pair to be in a corrective phase. I would stay cautious for another rebound and another test of the 0.8255 (R1) line. Our daily momentum indicators corroborate my view. The 14-day RSI edged up after finding support near its 30 line, while the daily MACD, although negative, stands above its trigger line and is pointing north.
• Support: 0.8145 (S1), 0.8035 (S2), 0.8000 (S3)
• Resistance: 0.8255 (R1), 0.8375 (R2), 0.8420 (R3)
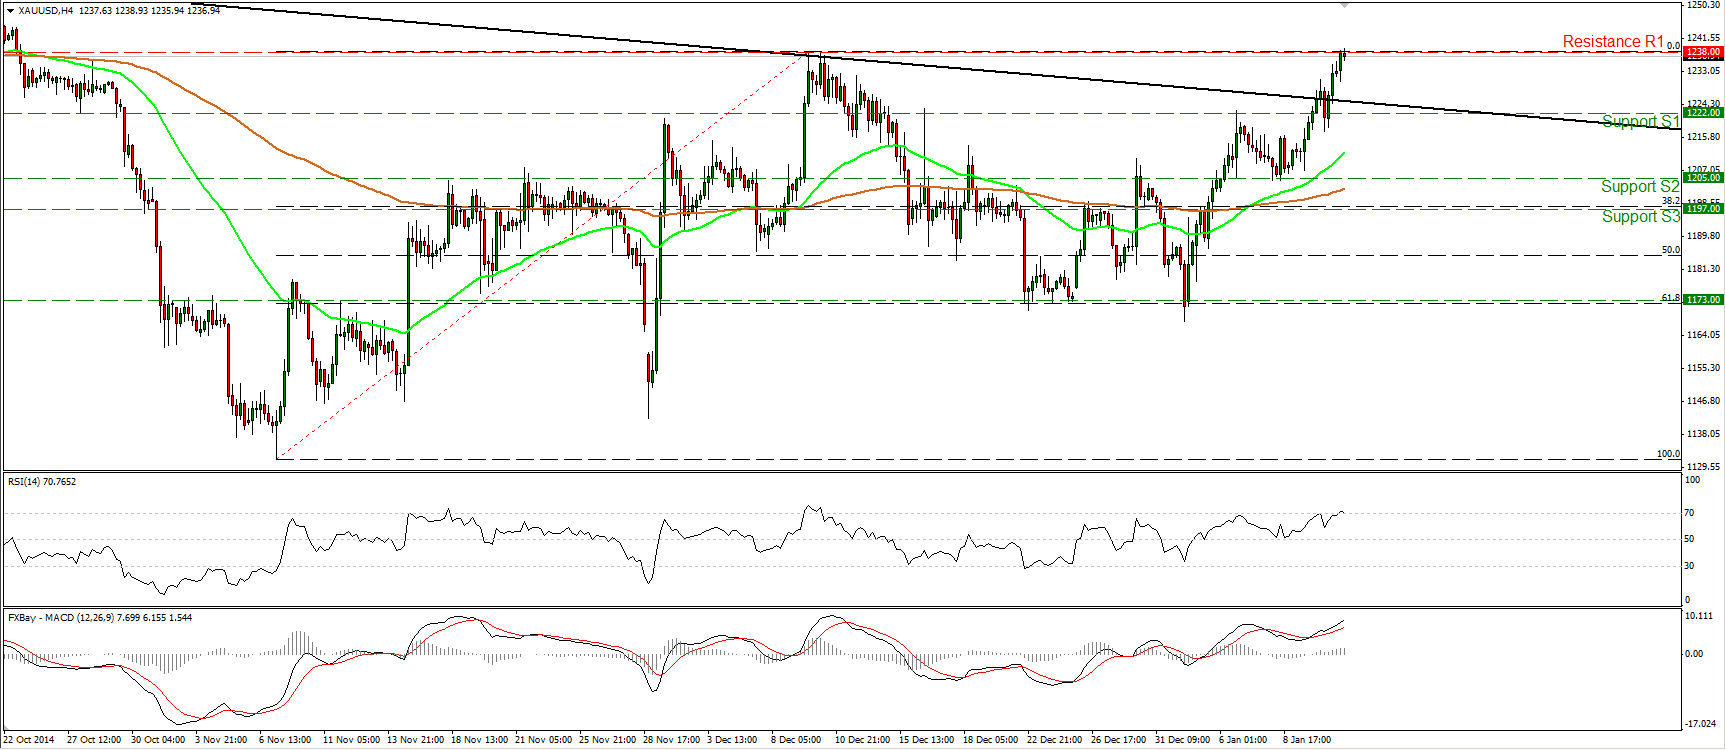
Gold is testing the 1238 area
Gold continued its surge on Monday after breaking above the neckline of a possible inverted head and shoulders pattern identified on the daily chart. During the early European morning Tuesday, the precious metal is testing the 1238 (R1) resistance hurdle, marked by the highs of the 9th and 10th of December. As I mentioned yesterday, a break above that key resistance area is the move I would like to see in order to trust the completion of the pattern and expect larger bullish extensions. Such a break is likely to challenge the 1255 (R2) hurdle at first stage. Our daily oscillators continue to detect positive momentum. Both of them, already within their bullish territories, are in a rising mode.
• Support: 1222 (S1), 1205 (S2), 1197 (S3)
• Resistance: 1238 (R1), 1255 (R2), 1270 (R3)
WTI keeps falling
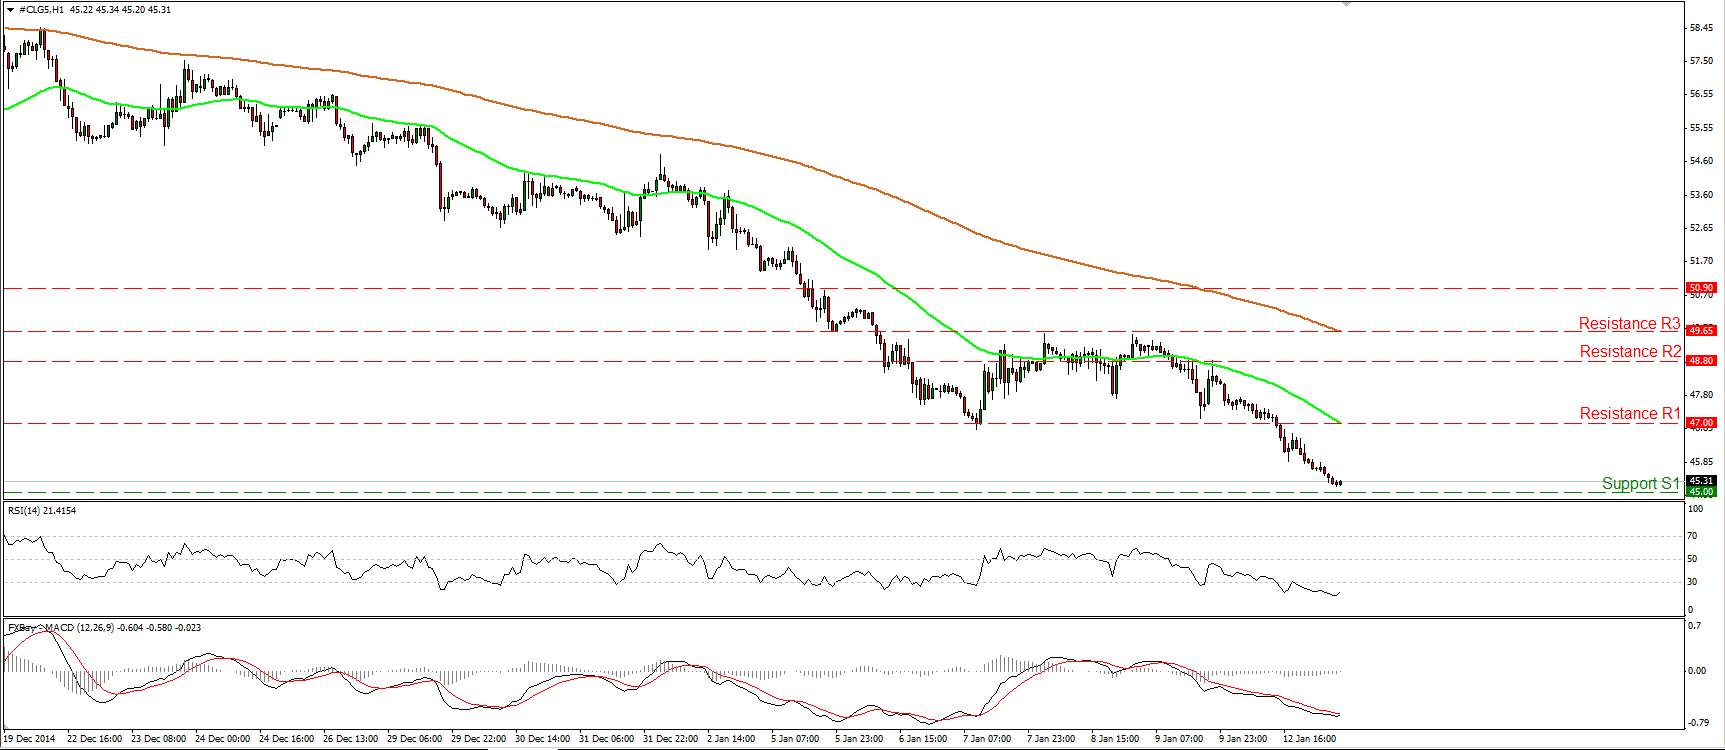
WTI continued tumbling on Monday, breaking below the support (turned into resistance) zone of 47.00 (R1) but the fall was halted fractionally above the psychological barrier of 45.00 (S1), at 45.15. The short-term bias stays to the downside and it won’t take long before we see the bears reaching the 45.00 (S1) line. If they are strong to drive the battle below that key level, I would expect them to set the stage for extensions towards the next support, at 42.15 (S2), defined by the low of the 11th of March 2009. On the daily chart, WTI is still printing lower peaks and lower troughs below both the 50- and the 200-day moving averages, which keeps the overall path to the downside.
• Support: 45.00 (S1), 42.15 (S2), 40.00 (S3)
• Resistance: 47.00 (R1), 48.80 (R2), 49.65 (R3)

