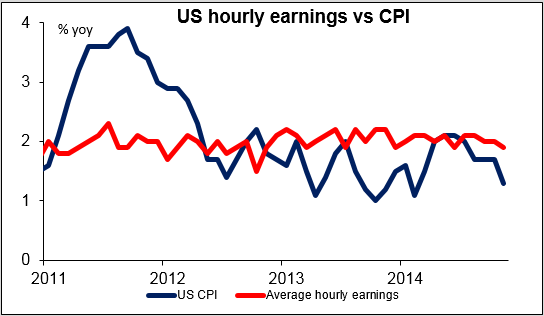
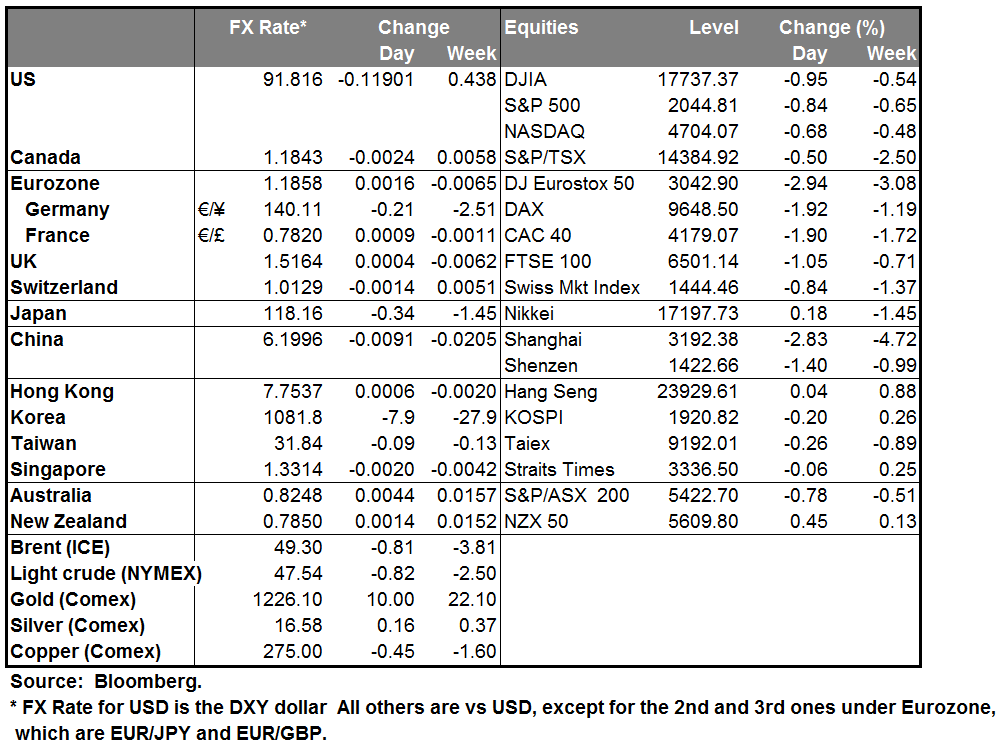
The devil is in the details US nonfarm payrolls soared by 252k in December, more than expected, and the previous month was revised up to an incredible 353k (October was revised up, too). This was the 11th straight month above 200k. Unemployment fell more than expected and the average workweek held steady, too. Sounds great, no? Instead, the market focused on the 0.2% mom drop in average wages (November was revised down too).
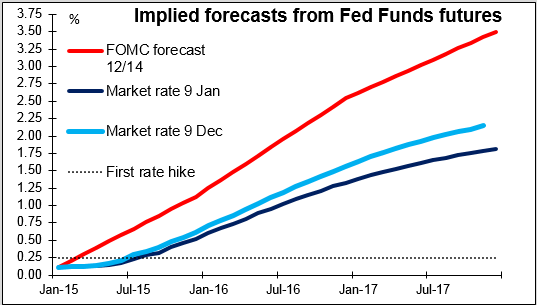
There was a lot of uncertainty about how to interpret the figures but at the end of the day, Fed funds rate expectations were down sharply. Investors apparently thought that the sluggish growth in average earnings coupled with falling oil prices would probably dampen any inflationary pressures and as a result they pushed out the time when they expect the Fed to start hiking rates.
Personally, I think the earnings figures may be an aberration as they don’t correlate with everything else that is going on in the labor market. I’m not sure that this will delay the Fed notably. This was the view of Atlanta Fed President Lockhart, who called the decline in average hourly earnings “potentially noise” and said it was inconsistent with other data on compensation. He said the strong rise in employment “confirms my sense of how the economy is progressing,” which would mean it’s still on track for a rate hike mid-year.
Richmond Fed President Lacker said that the fall in oil prices was complicating the picture, but he still expects inflation to move back towards the Fed’s 2% target, which means he’s still envisioning raising rates. So as far as we know, the figures didn’t change the view of anyone on the Fed and so don’t change the outlook for the dollar. Of course if wages keep falling, then they may delay a hike – they all insist that there is no set schedule and everything depends on the data. But it would be odd for so many more people to be hired without wages rising.
In general the dollar is lower this morning, rising only against NOK, SEK and CAD. The G10 currency that performed the best was AUD/USD even though home loans fell in November rather than rising as expected, although the ANZ job advertisements index rose more in December than it had in November.
In Canada, the unemployment rate remained unchanged at 6.6% in December, while the labor market lost 4.3k jobs. December was the second consecutive month for a drop in employment, consistent with the Bank of Canada’s concerns about significant slack in the labor market. Given falling oil prices and the slack in the job market, I would expect CAD to remain vulnerable.
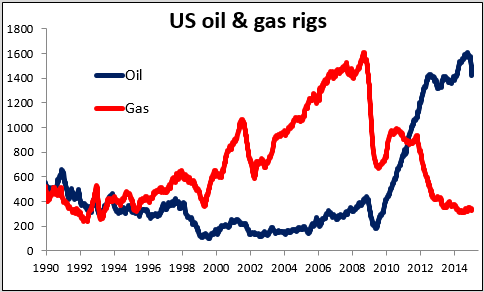
Crude fell sharply, with the number of rigs drilling for oil in the US falling by 61 this week, the most in 24 years. On the other hand, estimates of Saudi Arabian production for December have been raised, adding to the glut of oil now on the market. It appears that the near-term outlook for oil is still bearish, but the long-term outlook – starting next year, perhaps – is more bullish.
Today’s schedule: During the European day, we have no major events or releases scheduled.
In the US, we get the labor market conditions index for December. This is a monthly index that draws on a range of data to give a better sense of the employment conditions in a single measure. In November, the index came 2.9, so a reading above that, following the strong nonfarm payrolls on Friday, should indicate an improving labor market.
Atlanta Fed President Dennis Lockart speaks again. It will be interesting to see if a weekend of reading changes his view from what it was when he was interviewed on Friday.
As for the rest of the week, on Tuesday, Japan’s current account surplus is expected to fall a bit, which could prove JPY negative. Sweden’s CPI is expected to show that the country fell deeper into deflation. The minutes of the Riksbank’s December meeting confirmed that unconventional measures are being prepared and could be used if inflation fails to pick up. Given the further decline in consumer prices we could see action at the February meeting. The UK CPI is expected to fall below 1% driven mainly by lower energy prices. The decline confirms the warning in the BoE’s November inflation report that inflation is likely to fall below 1% within 6 months. This could push further back the expectations for tightening and add to the negative sentiment towards GBP.
On Wednesday, the Fed releases the Beige book two weeks before its Jan. 27-28 policy meeting. Retail sales for December are also coming out.
On Thursday, Australia’s unemployment rate for December is expected to remain unchanged, while employment is forecast to grow by less than it did the previous month. This could prove AUD-negative. From the US, we get the Empire State manufacturing survey and the Philadelphia Fed business activity index, both for January.
Finally on Friday, eurozone’s final CPI for December is expected to confirm the preliminary reading that showed the bloc in deflation. German final December CPI is also coming out. The US CPI for December is also coming out and the forecast is for the rate to decline below 1%, mainly because of the falling energy prices.
The Market
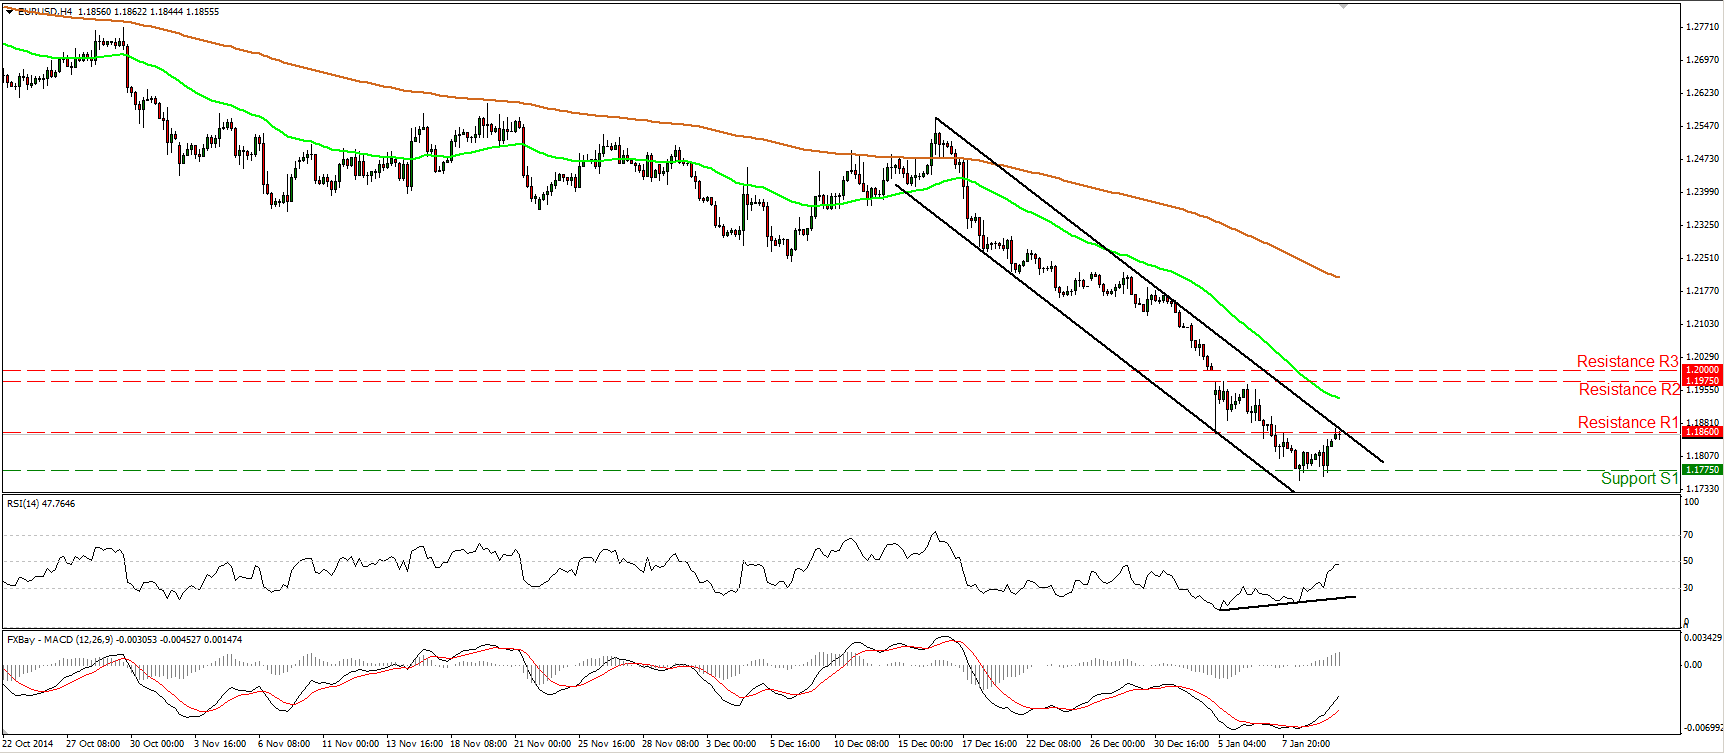
EUR/USD rebounds towards 1.1860
EUR/USD failed once again to close below our support of 1.1775 (S1) and rebounded to reach our resistance of 1.1860 (R1) and the upper bound of the short-term downside channel taken from back at the high of the 16th of December. Given that there is still positive divergence between the RSI and the price action and that both our momentum indicators raced higher, I see the possibility for a move above 1.1860 (S1), perhaps for a test of the resistance line of 1.1975 (R2). Nevertheless, since the rate is still within the channel, and since the longer-term trend of the pair is to the downside, I would prefer to sit on the sidelines for now and wait for more actionable signals that the bears are back in the game.
• Support: 1.1775 (S1), 1.1700 (S2), 1.1635 (S3).
• Resistance: 1.1860 (R1), 1.1975 (R2), 1.2000 (R3).
EUR/JPY ready to challenge the 140 line
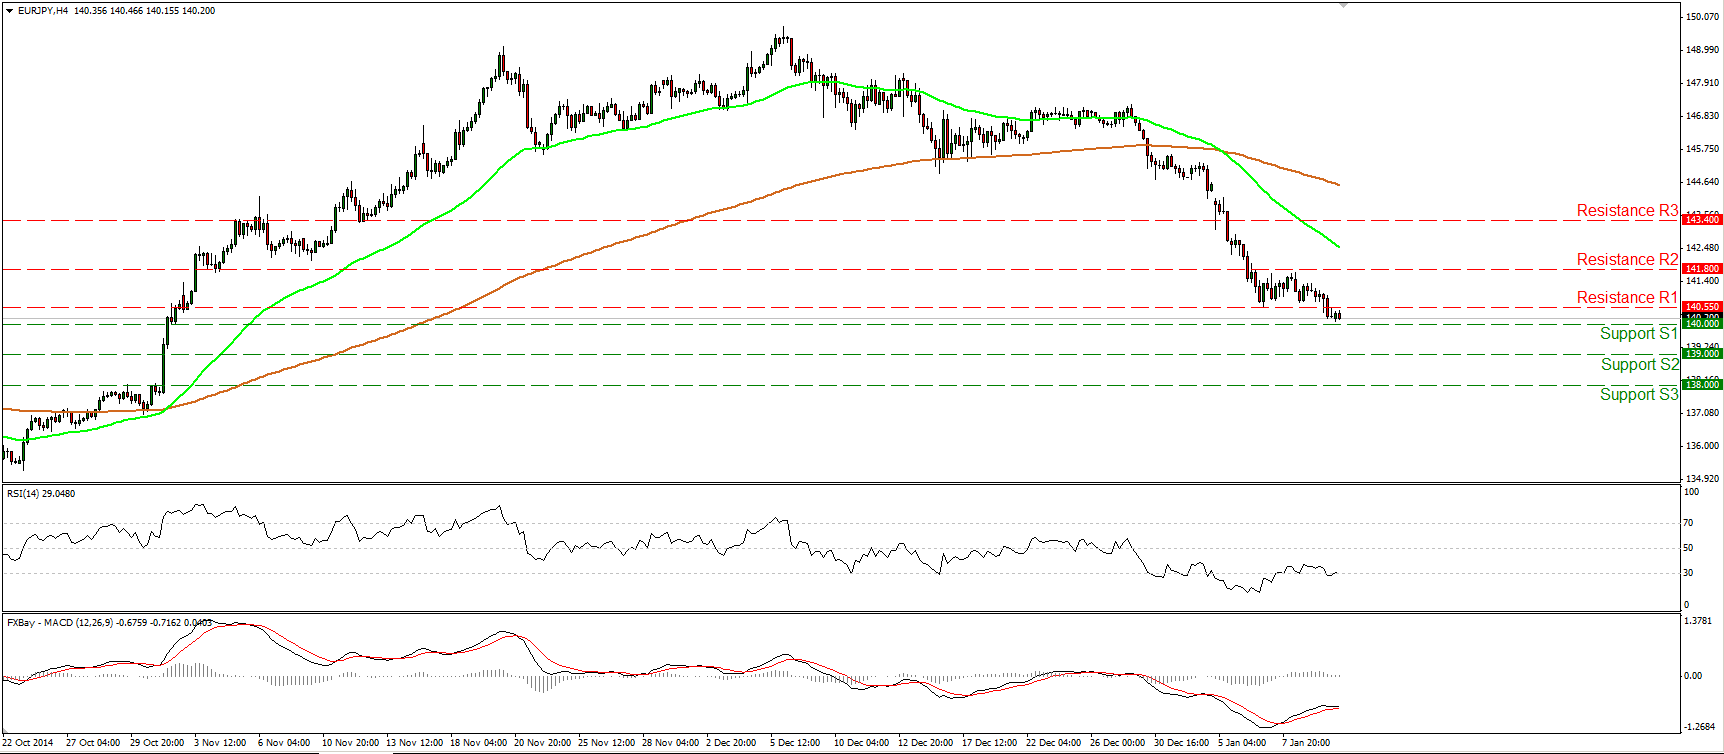
EUR/JPY continued its tumble on Friday, falling below the support (turned into resistance) barrier of 140.55 (R1). During the early European morning Monday, the rate appears ready to challenge the round figure of 140.00 (S1). A clear move below that line is likely to extend the bearish wave and perhaps target the support hurdle of 139.00 (S2). In the bigger picture, after the completion of a head and shoulders formation on the daily chart, the rate declined as expected and I would expect it to continue. Our daily momentum studies support the notion. The 14-day RSI fell below its 30 line and is pointing down, while the daily MACD stands below both its zero and signal lines, pointing south as well.
• Support: 140.00 (S1), 139.00 (S2), 138.00 (S3).
• Resistance: 140.55 (R1), 141.80 (R2), 143.40 (R3).
GBP/USD hits resistance at 1.5200
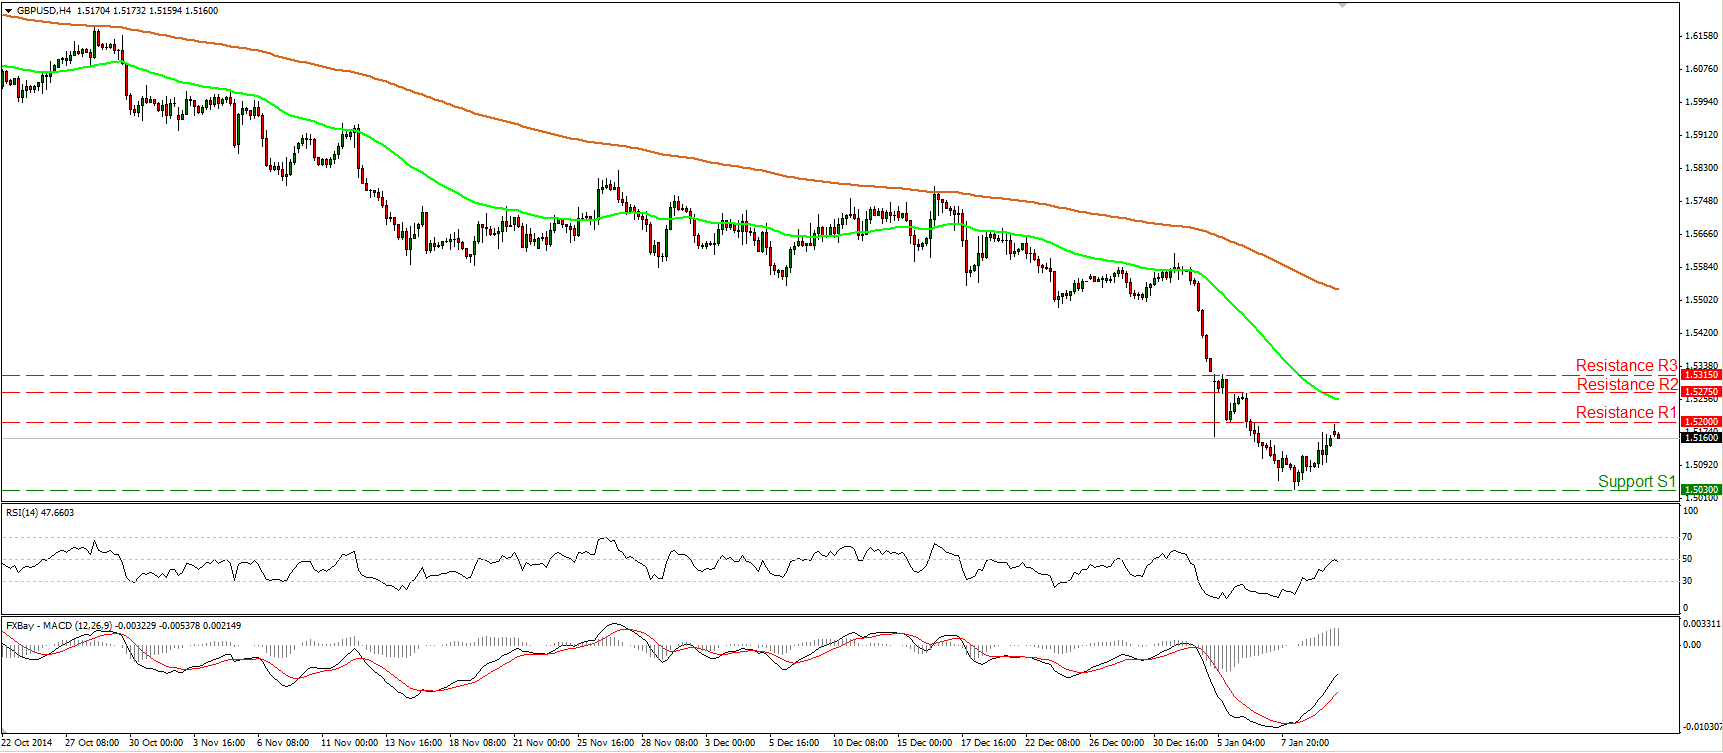
GBP/USD rebounded on Thursday after triggering some buy orders near the 1.5030 (S1) line. On Friday, the pair continued to race higher but hit resistance at the 1.5200 (R1) obstacle. Although the oscillators on the 4-hour chart point up, zooming on the 1-hour chart, the hourly studies combined with the strong resistance at 1.5200 (R1) give me reasons to believe that the forthcoming wave is likely to be to the downside. If so, I would expect another test at the 1.5030 (S1) area. In the bigger picture, as long as Cable is printing lower peaks and lower troughs below the 80-day exponential moving average, the overall outlook remains negative. Nevertheless, I would like to see a clear move below the psychological barrier of 1.5000 (S2) before getting more confident regarding the overall downtrend.
• Support: 1.5030 (S1), 1.5000 (S2), 1.4810 (S3).
• Resistance: 1.5200 (R1), 1.5275 (R2), 1.5315 (R3).
WTI slides after hitting resistance at 49.65
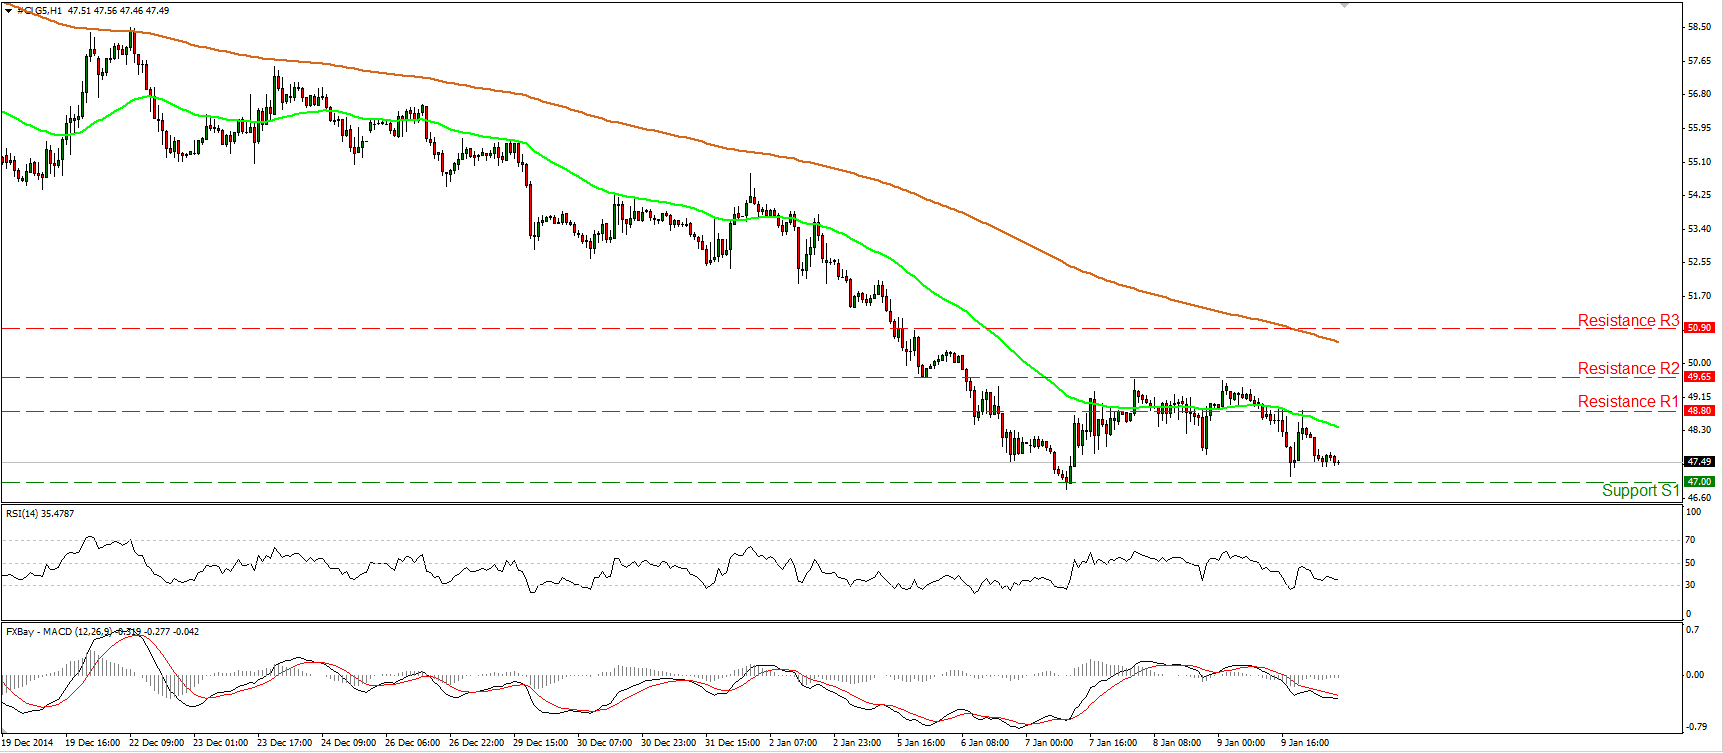
WTI declined after finding sellers near the 49.65 (R2) resistance hurdle. Today, during the early European morning, the price is heading towards the support zone of 47.00 (S1), where a clear dip is likely to set the stage for further bearish extensions, perhaps towards the psychological barrier of 45.00 (S2). Taking a look at our near-term momentum studies, I see that the RSI slid after hitting resistance marginally below its 50 line, while the MACD, already negative, shows signs of topping and could move below its signal line soon. On the daily chart, WTI is still printing lower peaks and lower troughs below both the 50- and the 200-day moving averages, which keeps the overall path to the downside.
• Support: 47.00 (S1), 45.00 (S2), 42.15 (S3).
• Resistance: 48.80 (R1), 49.65 (R2), 50.90 (R3) .
Gold rebounds from 1205
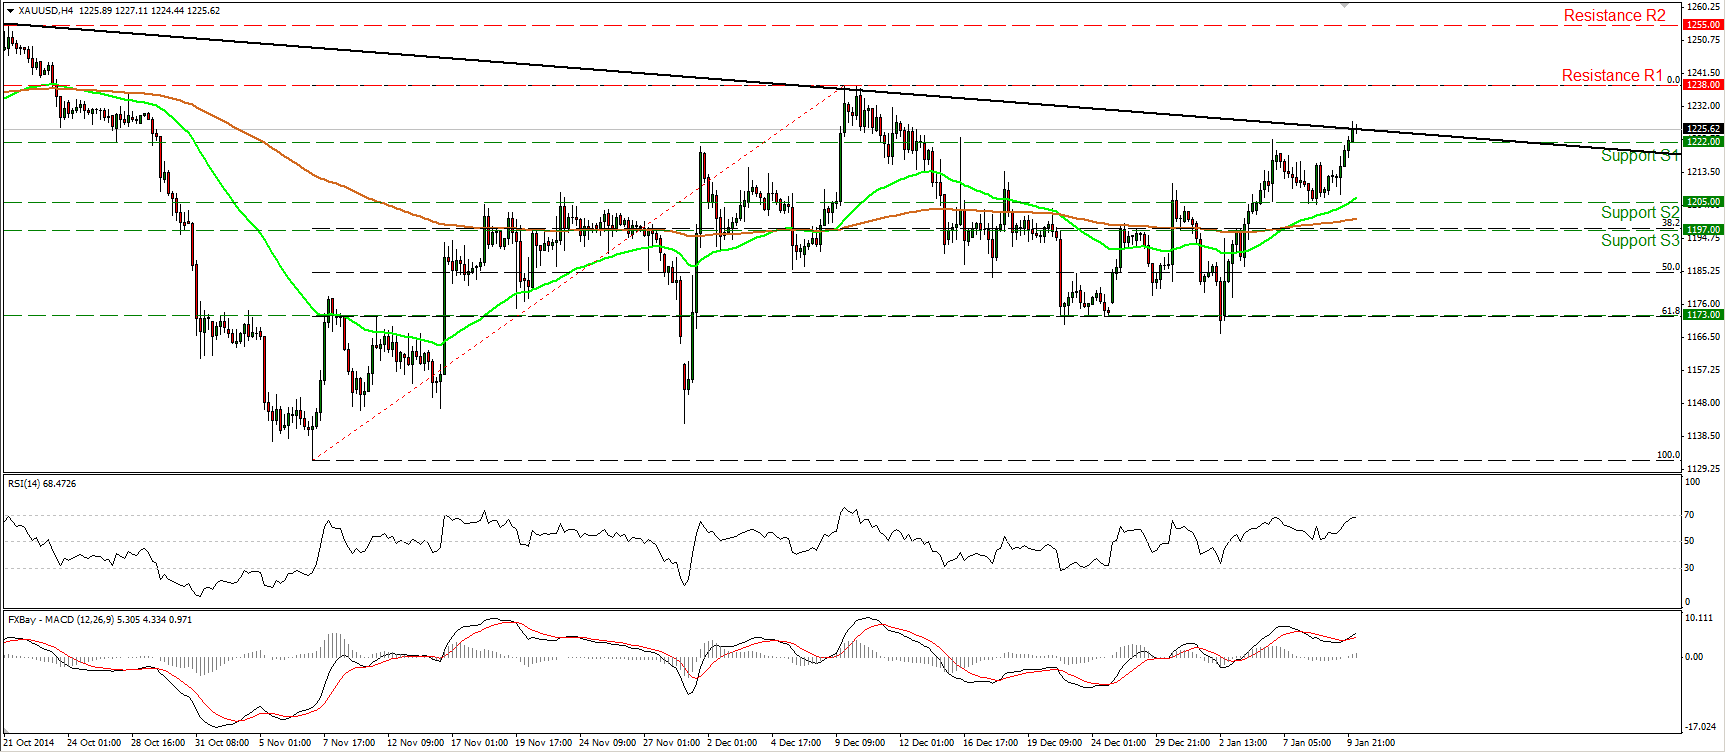
Gold firmed up on Friday, breaking above our resistance (turned into support) barrier of 1222 (S1). Currently, the precious metal is testing the neckline of a possible inverted head and shoulders pattern identified on the daily cart. A move above the neckline is likely to signal the completion of the pattern and perhaps have larger bullish implications. Nevertheless, I would prefer to see a break above the key resistance area of 1238, marked by the highs of the 9th and 10th of December, in order to trust the violation of the neckline and the completion of the pattern. The recent positive sentiment towards the yellow metal is visible in our daily momentum indicators as well. The 14-day RSI stands above its 50 line and is pointing up, while the daily MACD has a positive sign, lies above its signal line, and is pointing north as well.
• Support: 1222 (S1), 1205 (S2), 1197 (S3).
• Resistance: 1238 (R1), 1255 (R2), 1270 (R3).

