- SPX Monitoring purposes; Long SPX 10/22/20 at 3453.49.
- Monitoring purposes GOLD: Long GDX (NYSE:GDX) on 10/9/20 at 40.78.
- Long Term SPX monitor purposes; Long SPX on 10/26/20 at 3400.97.

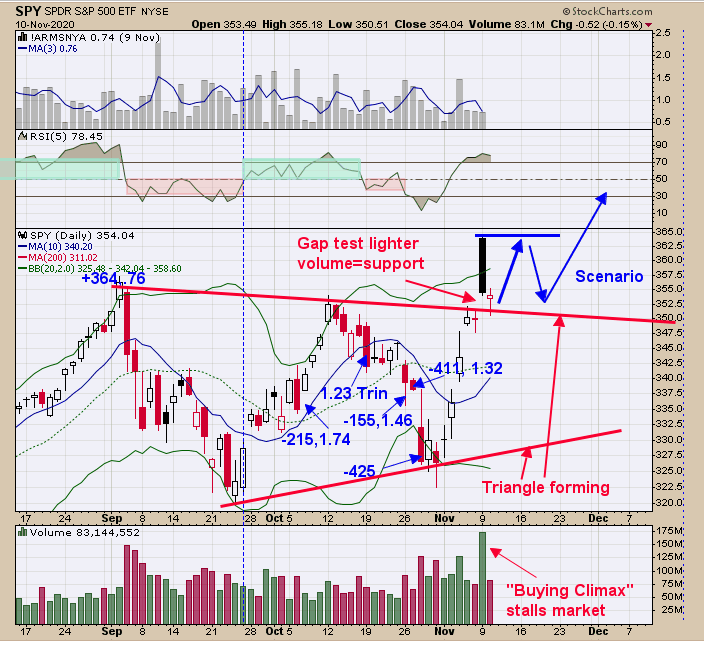
Volume exploded yesterday and that usually stalls the market short term. Support now comes at yesterday’s low if tested on lighter volume, which is the case. Resistance is now yesterday’s high if tested on lighter volume; which most likely will be the case and market may than fall back to support. This potential trading range could flow into Thanksgiving which is about two weeks away. Intermediate term trend is up but trading range developing over the short term. Will remain long for now.

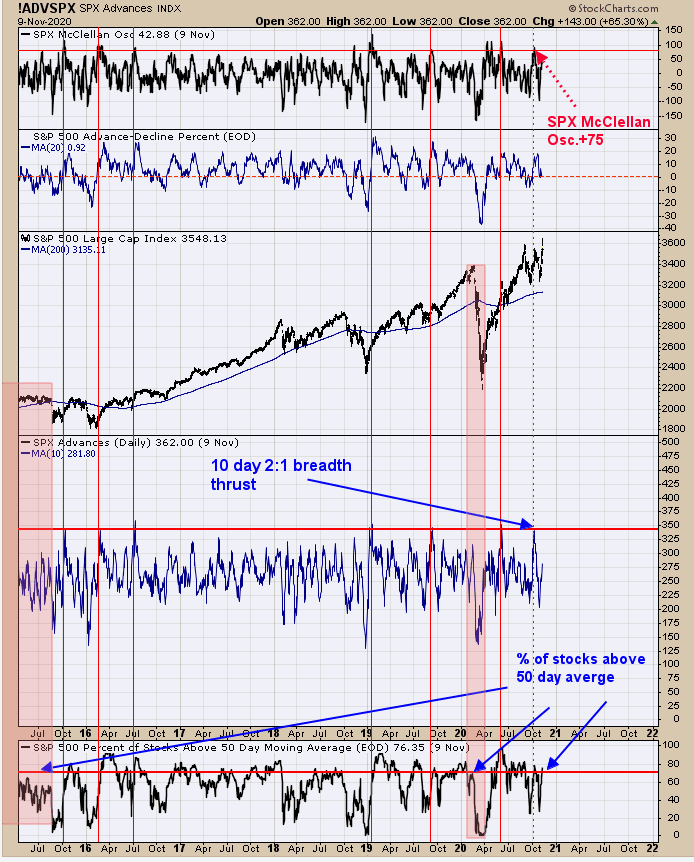
Yesterday we pointed out the “Zweig Breadth Thrust” (Zweig formula and named after). Above is the 10 day 2/1 breadth thrust (middle window) for the SPX. This breadth thrust reached bullish levels in mid October suggesting an intermediate term rally is forthcoming. The bottom window is the Percent of stocks above their 50 day average. Reading above 70% suggests market is in a strong position and the current reading is 76.35%. When the stocks above their 50 day average do not exceed 70% (noted in light pink) is when declines can occur.

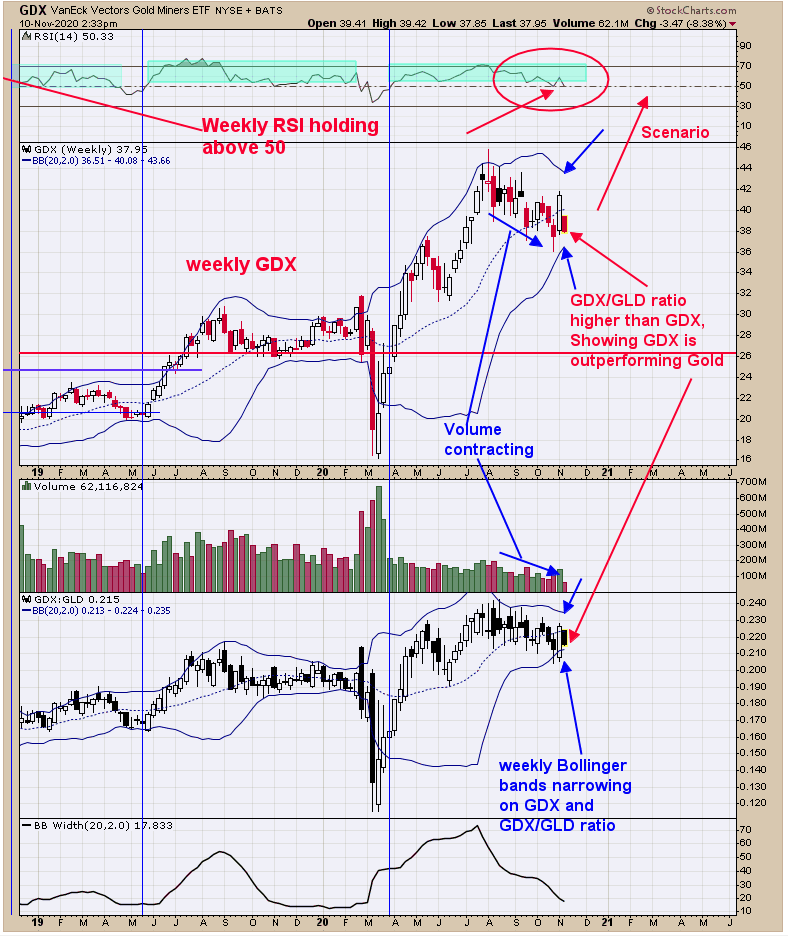
Yesterday we said, “Weekly GDX has been in a consolidation since early August and it appears this consolidation is near ending, in that the weekly Bollinger bands are starting to “Pinch”. The “pinch” is also occurring on the weekly GDX/GLD. The “pinching” suggests a large move is not far off for both indexes. It appears an impulse wave may be starting here or very soon.” Added to above, is that that weekly GDX is testing last week’s candle low and the weekly GDX/GLD ratio is near the middle of last week Candle showing that GDX is stronger than GLD (NYSE:GLD). In bullish moves in GDX; GDX out performs GLD and that is what is happening on the weekly charts. Long GDX on 10/9/20 at 40.78.
