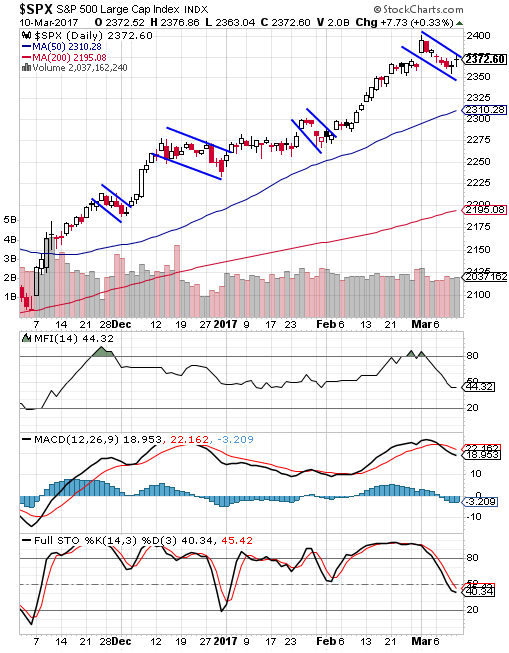
For the first few trading days in March, the equity market seems to be consolidating the gains achieved in February. Sideways or small market pullbacks have been a common pattern for the market since the election. For the most part the market has corrected over time (sideways movement) versus a steep contraction during the post election advance. This type of market pattern can be frustrating to investors waiting for a more significant pullback so cash can be deployed into the market. As the below chart shows, the type of pattern formed for the market is what is know as a bull flag chart pattern and this pattern has developed again with this month's trading action.

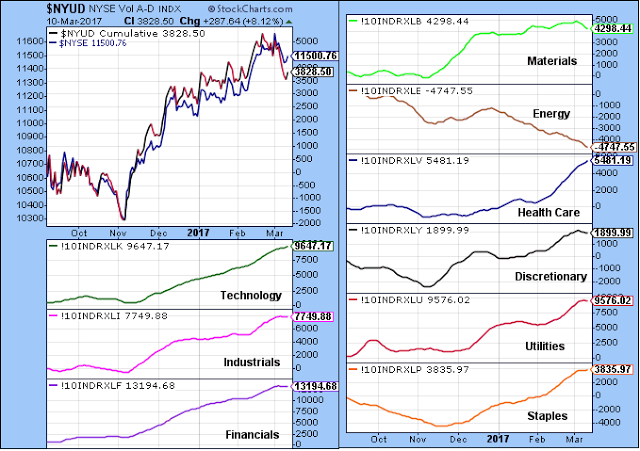
The other factor taking place, and worth watching to see if it goes beyond normal profit taking, is investors seem to be rotating out of the cyclically oriented sectors that tend to be more economically sensitive. We noted in a post in early October last year that investors were doing just the opposite, that is, investors were rotating out of income generating equities and into the economically sensitive ones. At HORAN, some of the portfolio changes we instituted in client accounts around that time resulted in a similar positioning which has proved beneficial with the market rally following the election.
The below chart shows the NYSE Index along with the cumulative advance decline lines for market sectors. Clearly, energy has weakened, and a discussion on the energy sector deserves its own article, but materials and discretionary are weakening as well. The A-D lines for the financial and industrial sectors have not turned decidedly down; however, they appear to be flattening. 
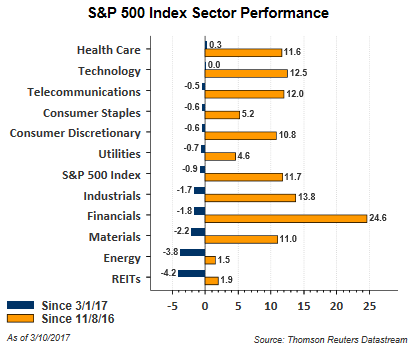
The rotation out of the cyclically oriented sectors is showing up in sector performance as well. For the most part, the sectors leading performance this month are more defensive ones, health care, telecommunications and consumer staples. The performance of the economically sensitive ones are near the bottom from a performance standpoint. Below is the sector returns from the March market high and returns since the election. 
The market's strong return following the election has likely occurred in part because of anticipated pro-growth economic policies, that is, a reduced regulatory environment and tax reform, to name a few. The pace of tax reform, or lack there of, makes us question whether the market will continue to trade at a higher valuation.
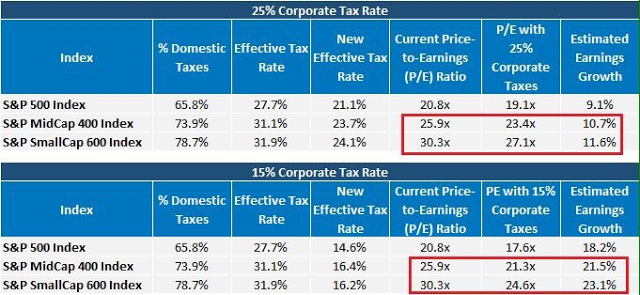
We do believe some of the stock run up has occurred in anticipation of a lower corporate tax rate. Reducing corporate taxes, and some type of tax reform around repatriated cash, would result in companies reporting higher earnings, all else being equal. This higher earnings level would then reduce company and market P/E's as can be seen in the below table. 
With the equity market's strong return since the election largely relying on 'anticipated' policies coming out of Washington, anything short of actual implementation could result in a pause in the market's advance. The recent rotation into more defensive market segments may be a sign some investors are beginning to hedge on the fact tax reform gets pushed into 2018. If this is the case, we do not believe the market would view a delay as a positive.
