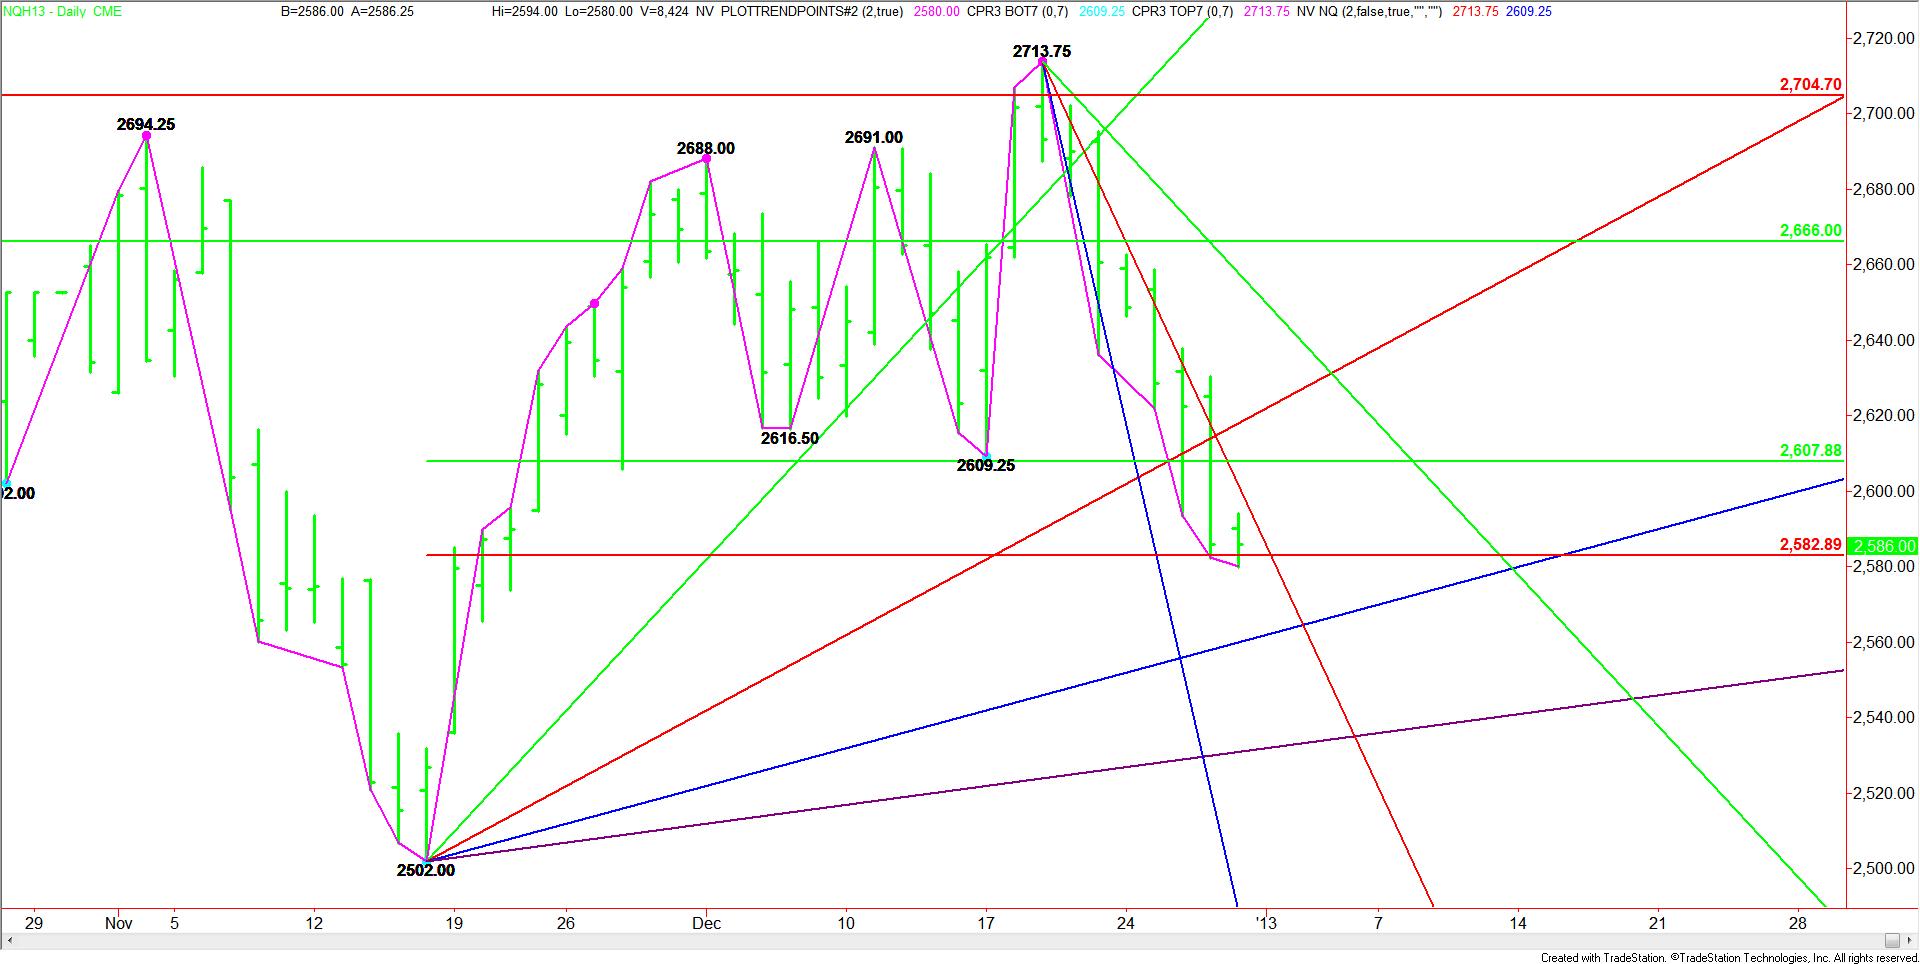
The March E-mini NASDAQ 100 futures contract is trading flat-to-better ahead of the shortened New Year’s holiday session. The index is currently straddling a key Fibonacci level while trading on the bearish side of a 50% price level.
Late last week the NASDAQ’s main trend turned down on the daily chart when it crossed a swing bottom at 2609.25. Based on the November 16 bottom at 2502.00 to the December top at 2713.75, a key retracement zone was created at 2607.75 to 2582.75. The market is currently testing this zone, but leaning toward the lower end of this range.

Controlling the steepness and direction of the current sell-off is a downtrending Gann angle at 2601.75. Look for the market to continue to weaken as long as it remains under this angle. If selling pressure continues under the Fibonacci level at 2582.75, then look for a test of an uptrending Gann angle at 2560.00.
The Gann angles suggest a possible test of 2564.00 to 2569.75 on January 3, 2013.
Since we are dealing with a new driven market, the first sign of strength will be an intraday breakout over 2601.75 then 2607.75. On the downside, a failure to hold 2582.75 could attract fresh selling pressure.
Late last week the NASDAQ’s main trend turned down on the daily chart when it crossed a swing bottom at 2609.25. Based on the November 16 bottom at 2502.00 to the December top at 2713.75, a key retracement zone was created at 2607.75 to 2582.75. The market is currently testing this zone, but leaning toward the lower end of this range.

Controlling the steepness and direction of the current sell-off is a downtrending Gann angle at 2601.75. Look for the market to continue to weaken as long as it remains under this angle. If selling pressure continues under the Fibonacci level at 2582.75, then look for a test of an uptrending Gann angle at 2560.00.
The Gann angles suggest a possible test of 2564.00 to 2569.75 on January 3, 2013.
Since we are dealing with a new driven market, the first sign of strength will be an intraday breakout over 2601.75 then 2607.75. On the downside, a failure to hold 2582.75 could attract fresh selling pressure.
