
Leading upstream energy player Marathon Oil Corporation (NYSE:MRO) posted third-quarter 2017 adjusted loss of 8 cents per share, narrower than the Zacks Consensus Estimate of a loss of 14 cents. Increased production activities especially from the U.S. markets and higher commodity price realizations drove the results. The loss also lowered than the year-earlier adjusted loss figure of 11 cents.
Quarterly revenues of $1,252 million surpassed the Zacks Consensus Estimate of $1,024 million. Further top line improved from the prior-year figure of $990 million.
Marathon Oil Corporation Price, Consensus and EPS Surprise
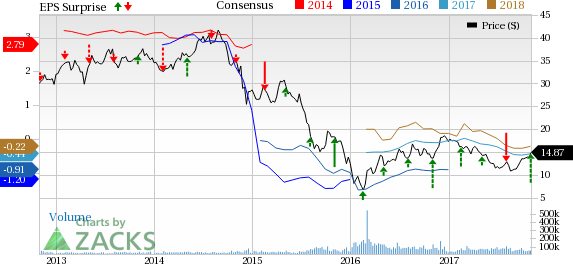
Marathon Oil Corporation Price, Consensus and EPS Surprise | Marathon Oil Corporation Quote
Segmental Performance
North America E&P: Marathon Oil’s North American upstream segment reported a loss of $38 million, narrower than the year-ago loss of $59 million. Higher price realizations and increased production boosted the segment’s results.
Marathon Oil reported production available for sale of 245,000 oil-equivalent barrels per day (BOE/d), up from 216,000 BOE/d in third-quarter 2016. The improvement was mainly driven by higher drilling and completion activities primarily in the Oklahoma Basin.
The company realized liquids (crude oil, condensate and natural gas liquids) price of $40.48 per barrel, higher than the year-earlier quarter level of $34 per barrel, reflecting an increase of 19%. Natural gas realizations increased 1.5% year over year to $2.71 per thousand cubic feet (Mcf).
International E&P: The segment’s income increased to $104 million, compared with the year-ago income of $59 million. Higher crude price realization drove the profit margin.
The company reported production available for sale (excluding Libya) of 126,000 BOE/d, slightly below the 128,000 BOE/d in the third quarter of 2016.
The company realized liquids price of $43.69 per barrel, a 43.7% rise from the year-earlier quarter level of $30.40 per barrel. Natural gas realizations increased 10.9% year over year to 51 cents per thousand cubic feet (Mcf).
Costs & Expenses
Marathon Oil’s total quarterly cost and expenses increased by 34.2% to $1,629 million in the reported quarter compared with the prior-year figure of $1,214 million. The increase is attributed to higher exploration, production, depreciation and impairment charges. However, the decrease was partially offset by reduced marketing and administrative expenses along with other operating costs.
Balance Sheet
As of Sep 31, 2017, Marathon Oil had cash and cash equivalents of $1,795 million. The long-term debt of the company was $6,488 million, leading to a debt capitalization ratio of 35.5%.
Production Guidance
Marathon Oil expects fourth-quarter 2017 North America E&P output available for sale in the range of 255,000-265,000 BOE/d and International E&P (excluding Libya) output in the range of 120,000-130,000 BOE/d.
Driven by the robust performance in the third quarter, the company has raised its production guidance for the full year to 350,000-360,000 BOE/d compared with the prior guidance of 345,000-360,000 BOE/d. Marathon Oil expects the production of the combined North America and International E&P segments, to end the year toward the top end of revised guidance.
Zacks Rank and Key Picks
Headquartered in Houston, TX, Marathon Oil is a leading exploration and production company with extensive operations across four core regions — Africa, Middle East, Europe and North America. The company presently carries a Zacks Rank #3 (Hold).
Some better-ranked players in the same industry are ConocoPhillips (NYSE:COP) , Hess Corporation (NYSE:HES) and Keane Group, Inc. (NYSE:FRAC) . While ConocoPhillips sports a Zacks Rank #1 (Strong Buy), Hess and Keane carry a Zacks Rank #2(Buy) each. You can see the complete list of today’s Zacks #1 Rank stocks here.
ConocoPhillips delivered positive average earnings surprise of 152.34% in the preceding four quarters.
Keane posted positive average earnings surprise of 27.47% in the preceding four quarters.
Hess reported positive average earnings surprise of 3.91% in the preceding four quarters.
Zacks’ Best Private Investment Ideas
While we are happy to share many articles like this on the website, our best recommendations and most in-depth research are not available to the public.
Starting today, for the next month, you can follow all Zacks' private buys and sells in real time. Our experts cover all kinds of trades… from value to momentum . . . from stocks under $10 to ETF and option moves . . . from stocks that corporate insiders are buying up to companies that are about to report positive earnings surprises. You can even look inside exclusive portfolios that are normally closed to new investors.
Click here for Zacks' private trades >>
Hess Corporation (HES): Free Stock Analysis Report
ConocoPhillips (COP): Free Stock Analysis Report
Marathon Oil Corporation (MRO): Free Stock Analysis Report
Keane Group, Inc. (FRAC): Free Stock Analysis Report
Original post
Zacks Investment Research