I am getting the feeling the economy is lifting. The actual data to support my feelings is not obvious.
Follow up:
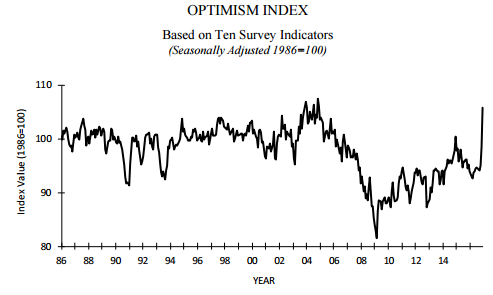
I have written on many occasions that I am biased against opinion surveys. The theory is that good times require optimistic businessmen and consumer. But too many things affect one's opinion on any particular day - but it was hard to ignore this week's NFIB Small Business Optimism Survey which skyrocketed to its highest level since 2004.

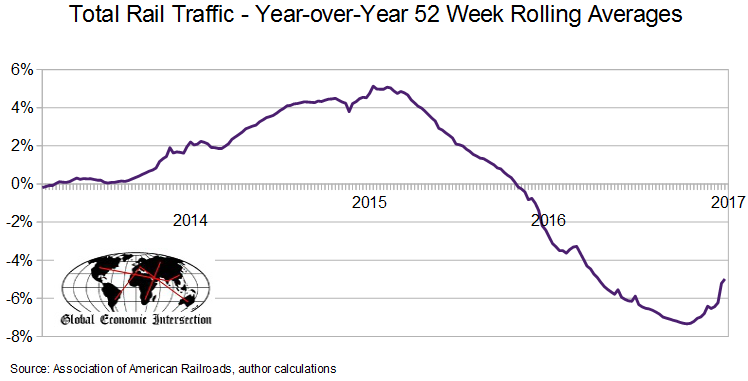
I also am seeing improvement in rail transport - which is a leading indicator.

Although rail's 52 week rolling average is not yet positive, it is on a steep improving trend [although this past weeks data showed deceleration the upward trend is still in play].
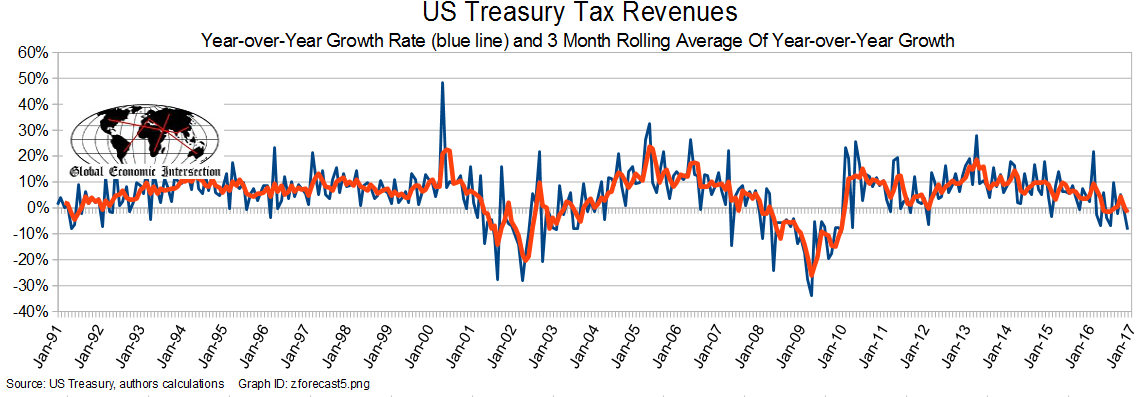
There is one lagging indicator which concerns me - US Treasury Tax Receipts.
For the Great Recession, the rolling averages went negative in February 2008 - two months after the Great Recession's start. For the 2001 recession, the rolling averages for tax revenues went negative two months after the official start of the recession. In May 2016, the rolling averages (red line) for tax revenues went negative, and since has been jumping between expansion and contraction.

According to the Congressional Budget Office, tax receipts are down 3 % in the first quarter of fiscal year 2017. This is an outlier statistic that defies logic. According to the BEA, income is up, and corporate profits are in positive growth territory.
The economy itself is billions of datapoints, some expanding, some contracting, and some unchanging at any point in time. One can always cherry pick data to prove any opinion or theory.
Certain data-sets have higher credibility (like Treasury data) as they have higher accuracy and are subject to literally no backward revision. Rail has some backward revision but has a higher accuracy than most other data pumped out. And added benefit is that rail and Treasury data is that it is issued close to real time.
I personally am glad that 2016 is behind us. The economy performed poorly, and it is against this background that the feeling of improvement evolves. When you compare 2016 terrible data against even pessimistic 2017 soft data - one starts to see there is a logical reason to expect improvement.
Other Economic News this Week:
The Econintersect Economic Index for January 2017 again insignificantly improved with the economic outlook for weak growth. The index remains marginally above the lowest value since the end of the Great Recession. But there are indications of better dynamics in our index in the future. Six month employment growth forecast indicates little change in the rate of growth.
Bankruptcies this Week from bankruptcydata.com: Homer City Generation - and issued the following statement:
BankruptcyData's analysis indicates that public company bankruptcy filings increased by more than 25% in 2016 on top of the 46% rise seen in 2015. A total of 99 publicly traded companies filed for Chapter 7/Chapter 11 protection last year with $105 billion in combined pre-petition assets, and 2016's crop of publicly traded filings includes an impressive 25 with assets greater than $1 billion - compared to 19 in the previous year. Continuing the trend we saw in 2015, 17 of 2016's 25 largest Chapter 11's were initiated by companies within the Oil & Gas, Mining and Energy sectors - and 41% of 2016's total public bankruptcies came from those industries. In fact, during the past two years alone, more than 80 public companies operating within these categories filed for U.S. Bankruptcy Court protection, with 30 of those petitioners listing more than $1 billion in pre-petition assets. Delaware continued to house the largest percentage of public Chapter 11's, with Delaware seeing 42% of all public filings in both 2016 and 2015. Notably, as a result of the high percentage of Oil & Gas sector restructurings, Texas continued to see more than its typical share of public company bankruptcy activity: The four Texas Districts housed 22% of all of 2016's public filings, a slight rise from 2015's already impressive 19%.
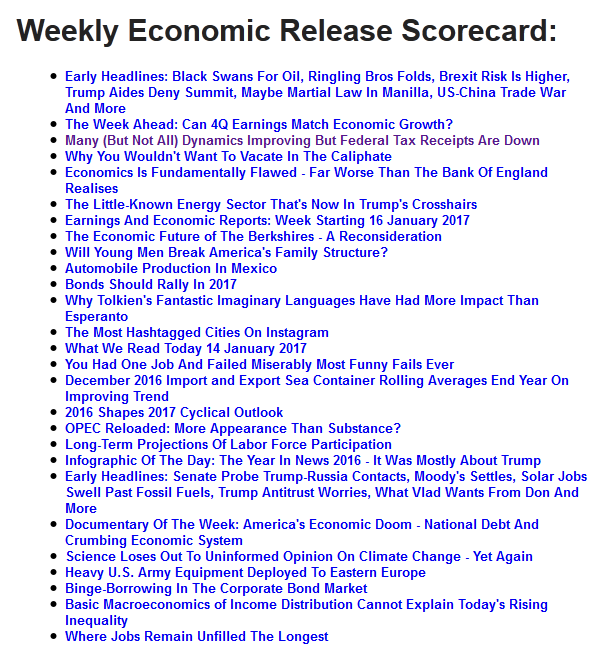
Click here to view the scorecard table below with active hyperlinks
Weekly Economic Release Scorecard:

Which stock should you buy in your very next trade?
AI computing powers are changing the stock market. Investing.com's ProPicks AI includes 6 winning stock portfolios chosen by our advanced AI. In 2024 alone, ProPicks AI identified 2 stocks that surged over 150%, 4 additional stocks that leaped over 30%, and 3 more that climbed over 25%. Which stock will be the next to soar?
Unlock ProPicks AI