Manufacturing in the USA is one topic which needs a little thought.
Follow up:
There is little argument that manufacturing activity peaked just before the beginning of the Great Recession - and it seems it may not have recovered to this pre-recession level.
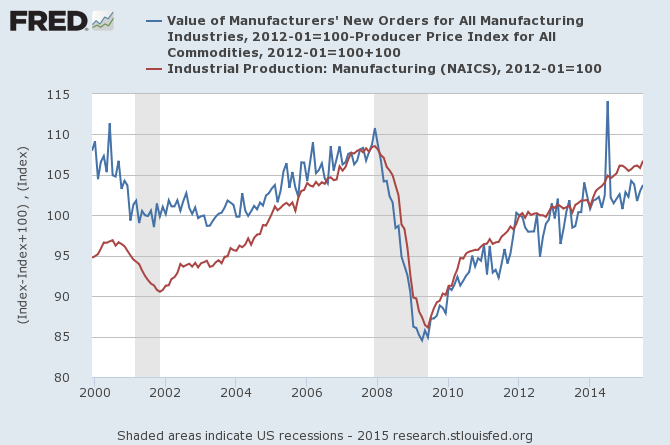
Some analysts talk about manufacturing, but use the Federal Reserve's Industrial Production index which includes mining and utilities. The above graph uses the manufacturing component only of industrial production (red line in above graph) - and it shows nearly a full recovery from the Great Recession. The problem using this metric is the US Census also produces manufacturing data - and it shows manufacturing remains further below the pre-recession peak (blue line in above graph which is an inflation adjusted index value).
And in any event, manufacturing employment is below World War Two levels and below most of the immediate post-war levels, as well. Remember the U.S. population was much less then.
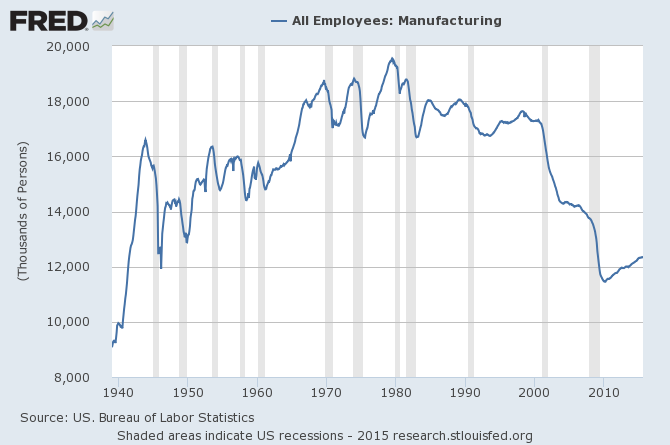
Note that the Fed's Industrial Production and the US Census use different pulse points which could explain deviations over short periods of time.
Let us say for now that the US Census data is correct (even though my guess is that neither is correct). What does this mean? Are Americans buying more foreign products?
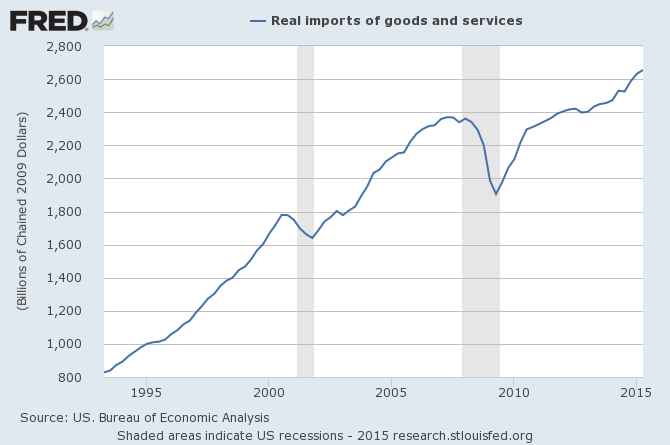
Yep! Americans are currently importing more than they did before the Great Recession. This is confirmed by the data from the BEA showing consumer's consumption of goods continues to rise.
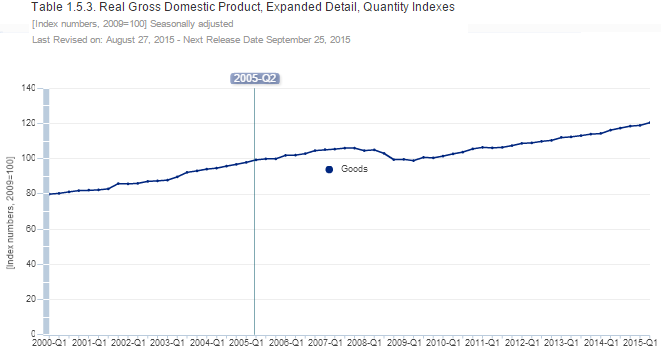
But the real question is - does it all matter? It does matter if you think that GDP actually measures the health of the economy. Perhaps 60 years ago - it did - when the basis of jobs and income was making or building things. In 2015 - less may be better for a variety of reasons - or not.
What does matter is that for a variety of reasons, every country must be able to produce a proportion of every commodity, component or manufactured item it needs. It does not need to provide 100% of its needs. What does matter is that an economy needs to provide jobs to its citizens. I guess that the 5.1% headline unemployment rate shows the USA economy is providing jobs.
..... and if you believe that, I have a bridge to sell you.
Other Economic News this Week:
The Econintersect Economic Index for August 2015 declined to the lowest level since April 2010. The tracked sectors of the economy remain relatively soft with most expanding at the lower end of the range seen since the end of the Great Recession. Our economic index has been in a long term decline since late 2014.
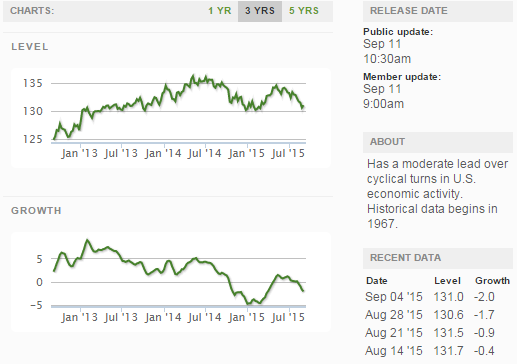
The ECRI WLI growth index is now in positive territory but still indicates the economy will have little growth 6 months from today.
Current ECRI WLI Growth Index
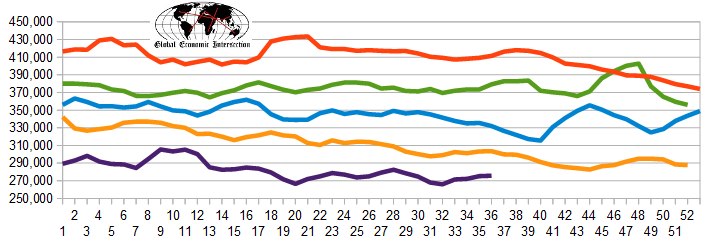
The market was expecting the weekly initial unemployment claims at 265,000 to 278,000 (consensus 275,000) vs the 275,000 reported. The more important (because of the volatility in the weekly reported claims and seasonality errors in adjusting the data) 4 week moving average moved from 275,250 (reported last week as 275,500) to 275,750. The rolling averages generally have been equal to or under 300,000 since August 2014.
Weekly Initial Unemployment Claims - 4 Week Average - Seasonally Adjusted - 2011 (red line), 2012 (green line), 2013 (blue line), 2014 (orange line), 2015 (violet line)
Bankruptcies this Week: Quiksilver
Click here to view the scorecard table below with active hyperlinks
Weekly Economic Release Scorecard:
