Remember when manufacturing inflation was as simple as stretching a balloon and then blowing into it? Well it certainly has not been that easy for the FOMC to manufacture some inflation. They had QE1, QE2 QE3……. zero interest rates for years and still no sign of inflation. With no inflation came no need to raise rates to control it.
There are signs now that inflation is creeping back in to the US economy. And maybe this will allow the Fed to start gradually increasing rates. You may follow the CPI or PCE like the FOMC does. Or you may look at the prices of Coffee, Oil, Sugar etc rising. Or you may follow the CRB index like I do.

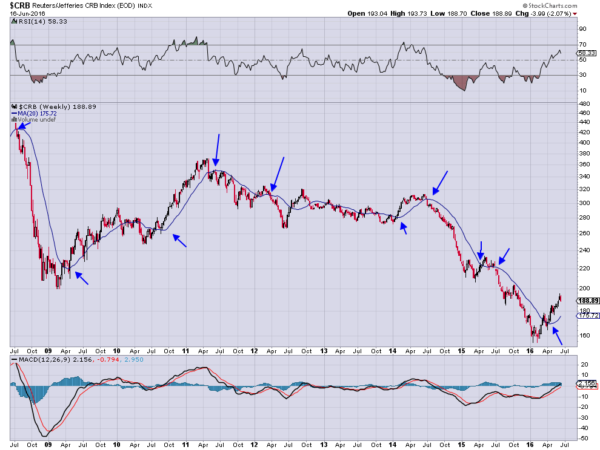
The chart of the CRB Index since 2009 above has a few very interesting things to say about the current path of inflation. First the RSI at the top of the chart has moved strongly off of an oversold condition and on the edge of the bullish zone. The MACD at the bottom of the chart is also bullish, having crossed up at the beginning of the year and now turning positive.
The meat of the chart is the CRB Index itself. It has been rising all year. After a long downtrend it usually takes some time and movement to confirm a reversal. But this has legs so far. And one key factor is that it has cleared its 20 week SMA. The arrows on the chart show other significant crosses of the 20 week SMA. Crossing the 20 week SMA has often been a signal of a trend change. This happened in April and the CRB has not looked back since. Has the FOMC finally succeeded, after 7 years, in manufacturing inflation?
