The ISM Manufacturing PMI registered 57.7 in February 2017, the highest value since August 2014 (revised). It was just slightly less than that peak in the 2014 “reflation” cycle. Given these comparisons, economic narratives have been spun further than even the past few years where “strong” was anything but:
The ISM’s gauge of orders increased to the highest level in just over three years, while an index of production posted its best reading since March 2011. The data were preceded by recent regional indicators showing similar strength that has prevailed since the presidential election as companies begin to step up investment and the global economy stabilizes.
“Things look good at this point,” Bradley Holcomb, chairman of the ISM survey committee, said on a conference call with reporters. “I don’t see anything here, or in the winds, that would suggest we can’t continue with this kind of pace going forward in the next few months.”
The comparisons to 2014 should instead induce caution. In terms of sentiment, there was nothing in those 2014 PMI’s to suggest what was about to happen. There was, however, in terms of so-called hard data of accounts like durable goods and factory orders.
Like the ISM PMI, factory orders in January 2017 (+5.5% Y/Y) rose at the fastest pace since 2014. It seems to be confirmation that the manufacturing sector has not only moved past the 2-year long manufacturing recession but may actually be breaking into full growth. That idea, however, is easily dispelled by those very comparisons to 2014 rather than 2011 (or before). In other words, while the growth rate of 5.5% might sound impressive given the steady low-scale contraction of those two years, it represents growth at the post-2012 pace rather than growth at a normal pace (therefore “not growth”).
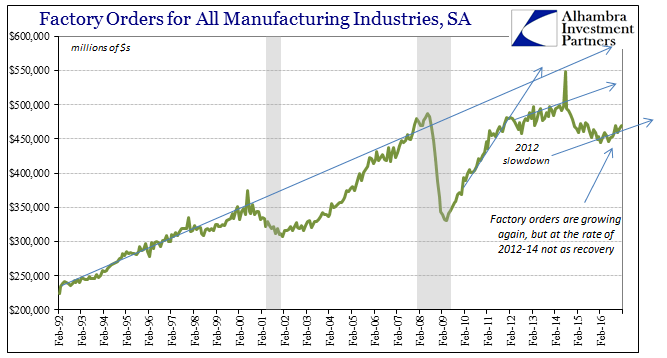
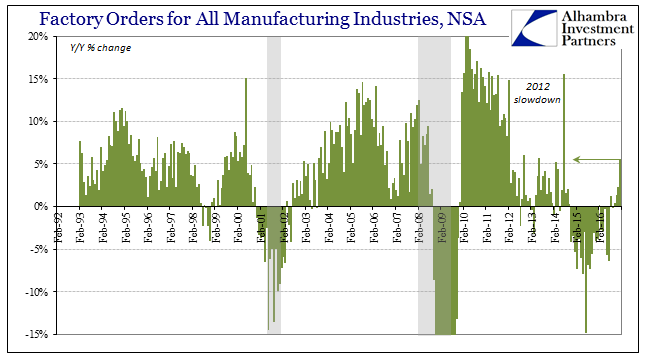
It’s as if the “rising dollar” manufacturing contraction ended and the factory sector simply resumed its lackluster expansion as it was before it. That’s not how this is “supposed” to work, where the economy or any important sector falls off for years at a time and then just goes back to as before. There is typically symmetry to these processes, where after contracting for so long that sector will rapidly expand to something more like normal.
Even growing 5.5% in January 2017 above January 2016, factory orders remain 4% less than in January 2014, now three years in the past. That leaves a considerable discrepancy between sentiment (and PMI’s) which captures only the short run change in signs without accounting for any of the intermediate term depressed trend that remains.
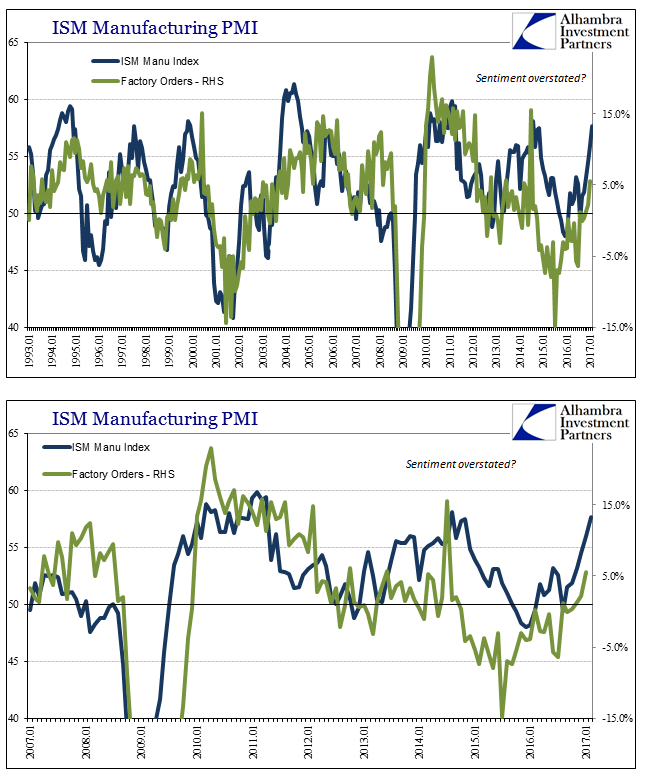
Unlike in past circumstances, the ISM PMI never really registered the downturn in either factory orders or durable goods. Instead, the PMI does pick up on the upturn without ever reconciling that difference; a disparity of trend that clearly dates back unsurprisingly to the post-2012 break.
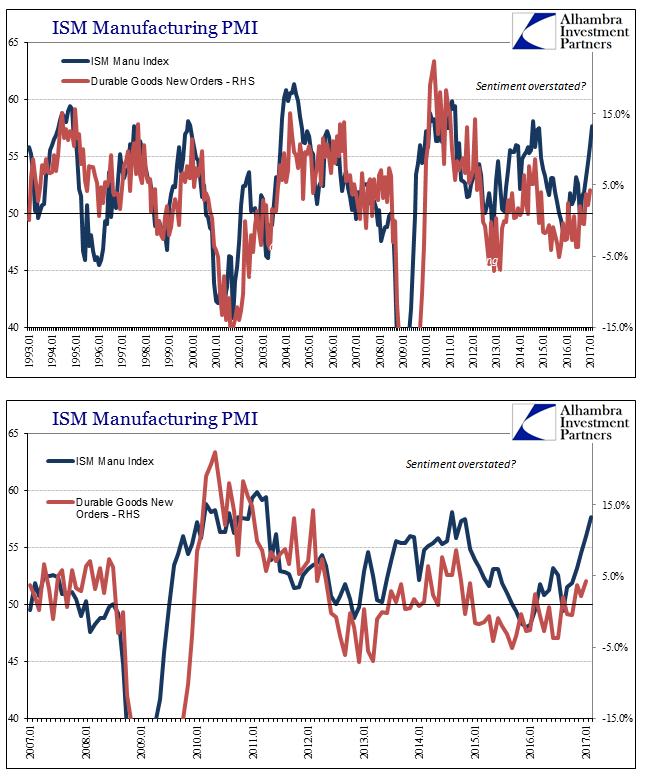
That leaves the manufacturing sector, as stated at the outset, with far too many comparisons to 2014. That is an important distinction because, obviously, the “reflation” of 2013-14 wasn’t that at all. It was, as now, simply what occurs when the global eurodollar system isn’t actively disrupting real economic function. “Reflation” is the space between “dollar” events where conditions appear to be better but only in that isolation of plus signs against minus signs.
Positive numbers are always better than negative ones, but even after two years of declines the uptick to non-negative doesn’t necessarily indicate anything has changed except the immediate status of the eurodollar system. As I often write, this is, in fact, the worst case scenario because with economic pressure no longer actively building the sense of urgency to do something about it will quite naturally recede. Given the further fractures along political lines, we go back to 2014 in terms of narrative as well as condition (full employment rhetoric and believing in the unemployment rate).
This is as the default setting in the mainstream – if it isn’t contracting then the economy must be growing. In reality, given how the “manufacturing recession” was treated (dismissed) in the same places and in the same general way, it is actually believed that if it isn’t contracting by a lot no matter for how long then the economy must be growing. The actual state of the economy is quite the opposite, for if it isn’t growing rapidly then it isn’t growing at all. That point is best demonstrated by the seasonally-adjusted series for factory orders (or any economic account) in the gap to where they would be if the Great “Recession” had been a recession.
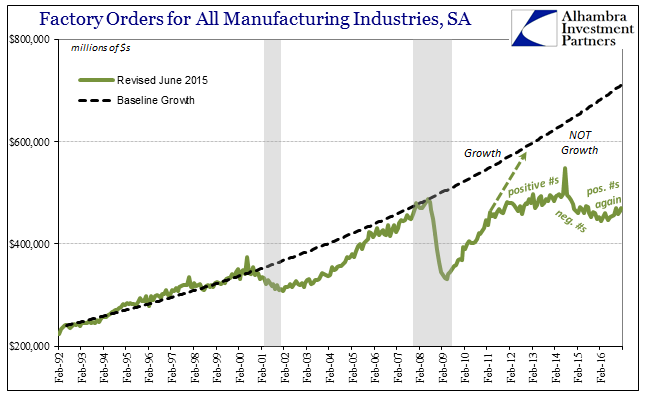
It is that breach which denotes growth versus not growth; if it continues to get bigger even with positive numbers for a given month, then we remain in “not growth.” That was the case in 2014 and it continued all through the three years since no matter plus or minus. Unless something actually and meaningfully changes from here on, we are stuck if but happier and more optimistic about it.
