
Shares of Mallinckrodt Public Limited Company (NYSE:MNK) gained 10.2% after it delivered better-than- expected results for the fourth quarter of 2018.
The company reported adjusted earnings of $2.18 per share in the quarter under review, up from the year-ago quarter’s tally of $2.01. Also, the bottom line beat the Zacks Consensus Estimate of $1.93.
Net sales in the quarter came in at $834.9 million, up 5.4% year over year. The figure surpassed the Zacks Consensus Estimate of $640.2 million.
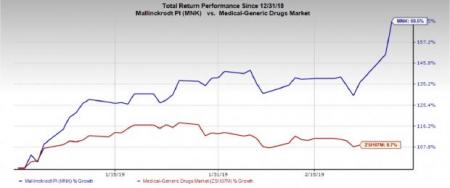
Mallinckrodt’s stock has gained 69.5% in the year so far, against the industry’s gain of 8.7%.
Quarter in Detail
The company now operates two reportable segments aligned to the previously announced separation — the Specialty Brands as well as the Specialty Generics and Amitiza segments.
Specialty brand sales came in at $586.5 million, down 0.9% year over year.
Acthar, Mallinckrodt’s largest product, generated sales of $280.3 million, down 4.1% due to the residual impact of the previously reported patient withdrawal issues.
Inomax, its second-largest product, generated sales of $138.7 million, up 10.4% driven by strong demand. Ofirmev sales increased 11.8% year over year to $87.2 million, owing to strong demand stemming from customers’ focus on non-opioid or multimodal pain management.
Sales of the Therakos immunology platform were $57 million, down 0.3%.
Specialty and Amitiza sales amounted to $248.4 million, up 23.8%.
Amitiza sales came in at $64.6 million. The drug was added to Mallinckrodt portfolio as a result of erstwhile Sucampo Pharmaceuticals’ acquisition.
Adjusted selling, general and administrative expenses in the quarter were roughly flat at $212.2 million. Meanwhile, research and development expenses increased 16.2% to $100.4 million.
During the quarter, the company reduced total debt by $384 million.
2018 Results
The company generated sales of $3.216 billion in 2018 compared with $3.22 billion in 2017, which beat the Zacks Consensus Estimate of $2.48 billion. Earnings per share (EPS) of $8.01 surpassed the Zacks Consensus Estimate of $7.09.
Guidance
Total sales for Specialty Brands are expected to increase 1-4%. Total sales for Specialty Generics and Amitiza are expected to increase 1-4%. Adjusted diluted EPS guidance for 2019 is projected in the range of $8.10-$8.40.
Our Take
Impressive results in the fourth quarter bode well for Mallinckrodt, which has been in troubled waters for quite some time now. The hospital portfolio looks solid.
The year is expected to be a transformative one for Mallinckrodt as it strives to revive product portfolio/pipeline. In Dec 2018, the company announced that it intends to spin-off the Specialty Generics/Active Pharmaceutical Ingredients business and Amitiza into a new company.
The company expects to create two independent, appropriately-capitalized and publicly-traded companies. One entity will focus on innovative specialty pharmaceutical brands and the other primarily on niche specialty generic products as well as API manufacturing. The spin-off is expected to be completed by the second half of 2019.
Zacks Rank & Other Key Picks
Mallinckrodt carries a Zacks Rank #2 (Buy).
Other top-ranked stocks in the healthcare sector include AstraZeneca PLC (NYSE:AZN) , GlaxoSmithKline Plc (NYSE:GSK) and Celgene Corp. (NASDAQ:CELG) . While Celgene carries a Zacks Rank #1 (Strong Buy), AstraZeneca and GlaxoSmithKline carry a Zacks Rank #2 (Buy). You can see the complete list of today’s Zacks #1 Rank stocks here.
Celgene’s EPS estimates have increased from $10.21 to $10.75 for 2019 and from $11.63 to $12.70 for 2020 in the past 60 days.
AstraZeneca delivered positive earnings surprise in all of the trailing four quarters, the average being 106.4%.
GlaxoSmithKline’s EPS estimates have increased from $2.86 to $2.95 for 2019 and from $2.93 to $3.05 for 2020 in the past 60 days.
Is Your Investment Advisor Fumbling Your Financial Future?
See how you can more effectively safeguard your retirement with a new Special Report, “4 Warning Signs Your Investment Advisor Might Be Sabotaging Your Financial Future.”
GlaxoSmithKline plc (GSK): Free Stock Analysis Report
AstraZeneca PLC (AZN): Free Stock Analysis Report
Celgene Corporation (CELG): Free Stock Analysis Report
Mallinckrodt public limited company (MNK): Free Stock Analysis Report
Original post
Zacks Investment Research