I pen this while listening to the pundits talk about the terrible economy moving forward. I too think the USA economy going forward will be mediocre at best. This week ECRI has stated the recession began in July pointing to recession markers (peaks in certain significant broad measures).
Has the recession begun? It does appear the economy has peaked in certain broad measures – but this has occurred before without a recession occurring. However, if the current trend lines do not change in the coming months, then it is true that the recession could be marked beginning July 2012 (all data subject to backward revision). Our December economic forecast released this week provides a roundup of the important economic data points.
How is it possible we are discussing another recession? Did we not pump the economy full sugar and spice and everything nice (aka TARP, bailouts, American Recovery and Reinvestment Act), and were told by the economic masters that all would be well again?
Could it be that the economic masters are not fully understanding economic dynamics? If economic principles that are “true” were fact, then creating economic growth is as simple as following a cookbook.
My simple theory is that people making and doing things are the economy. A corollary is that measuring money flows is at best a secondary measure of the involvement of people in the process. And if my theory of the economy is true, then growing the economy would require more people doing or making more things. In the simplest sense, the natural growth of an economy would be population growth. Each new person consumes adding proportionally to the economy. The following graph indexes population growth to GDP.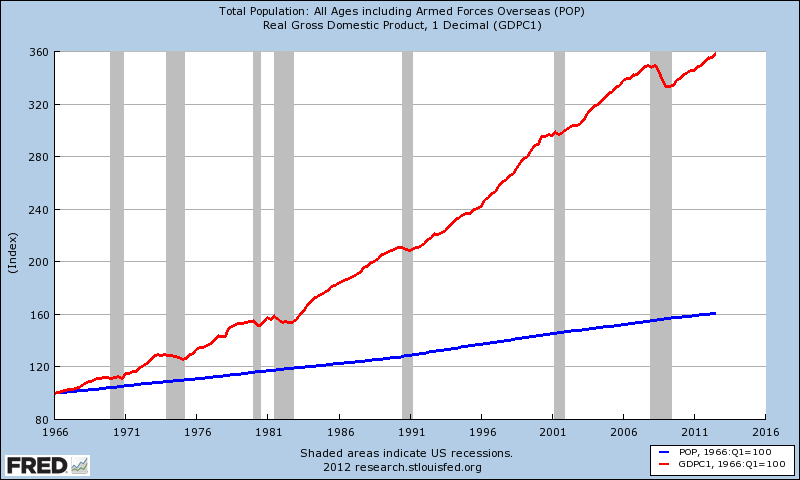
From the graph above, using population growth alone to establish economic growth potential must be ignoring many factors – and one is employment and its associated income from employment. As people in the 21st century seem unable to make their own job, they are relying on others to create a job for them. The graph below adds to the index the changes in the employment -population ratio 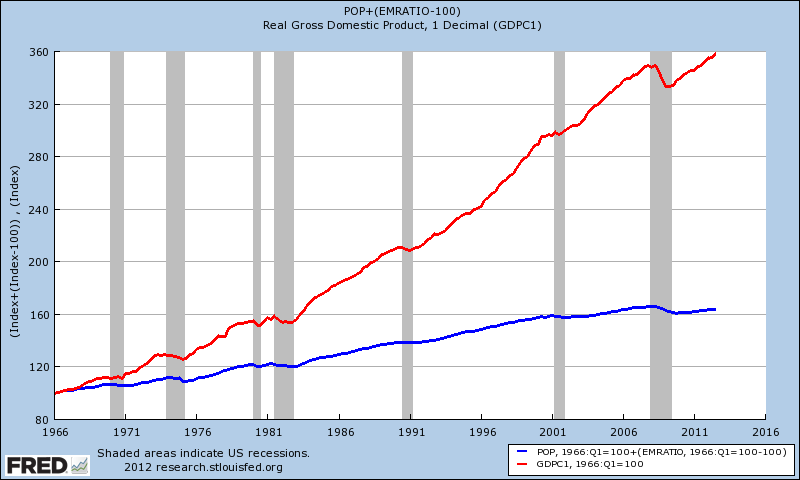
Even doing this, it explains only half of the GDP. Some pundits and economists believe economic growth is population growth plus productivity – and the math fits, approximately.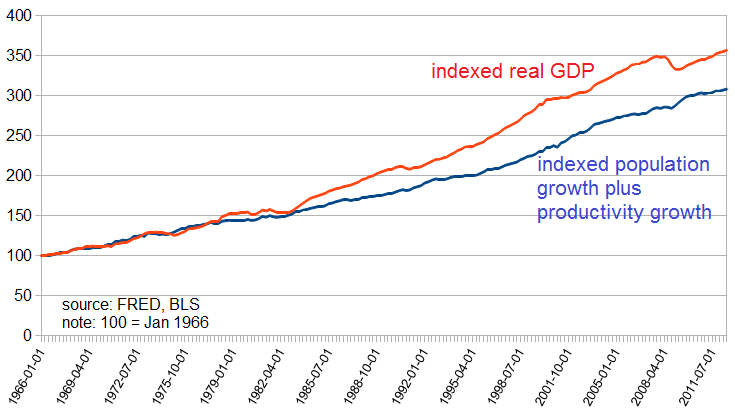
The problem with thinking productivity is the magic ingredient: 2/3rds of GDP is consumer consumption. I see real productivity having little more than a passing relationship to GDP. I take variables to absolutes to test theories. If a machine was invented to replace every person but one in the USA – productivity would skyrocket but does anyone think GDP would skyrocket?
In any event, productivity does not directly effect worker’s earnings, and may even lead to a decline in the number of human workers. What is being missed in the discussion of productivity relating to GDP is standard of living. This transcends productivity; productivity is a subset of the standard of living universe. When increased productivity accrues benefit unequally across a society, as has happened over some long periods of time, median standard of living can degrade, even when average does not. The standard of living should correlate in some manner with consumption, and the median standard of living should be a function of income distribution. But this is another topic for another time.
What could explain GDP is debt. Debt is the growth elixir. Economic theory rarely defines operational boundaries – so if a little is good, more is better. Therein lies a serious trap.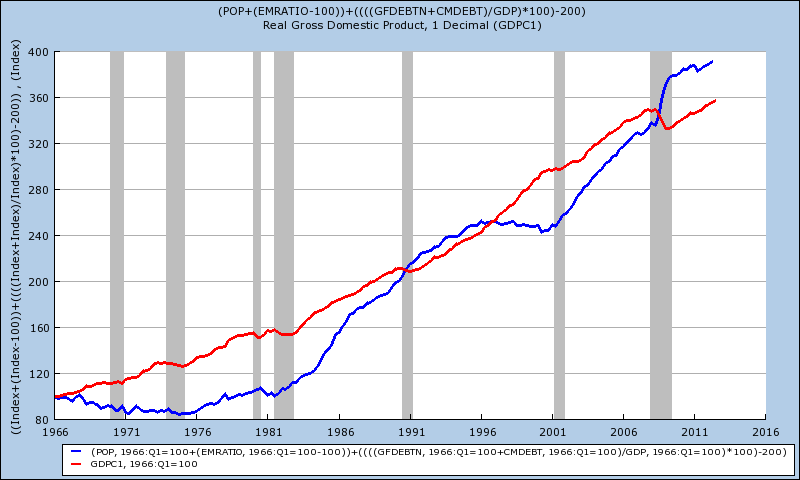
The economy going forward will be bad because we are not employing enough of the population – and the option of self employment (which requires tax reporting, permits, licensing, liability coverage, bonds, loans, etc) is beyond the reach of Joe Sixpack. When an economy cannot create jobs, it must remove impediments to self employment.
The economy is people providing goods and services – and money is the vehicle of exchange which is used to determine GDP. Consider that the ratio of employment income relative to GDP has been falling.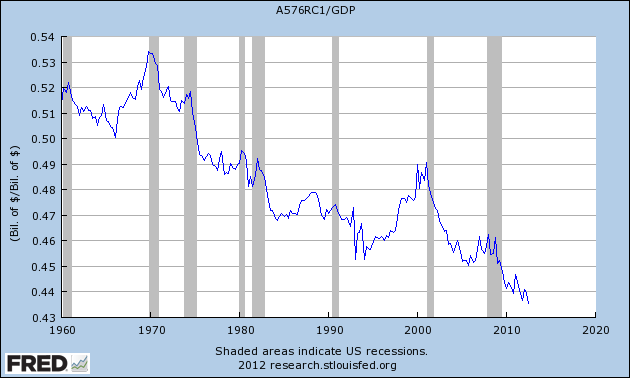
Could this is the productivity improvement economists tout (needing less humans to grow the economy)? In any event, this trend is not good – and summarizes why the USA consumer based economy will be mediocre at best.
Joe Sixpack simply does not have enough income so that he can consume more.
Added note: There is an economic factor that is not measured in the data here: the underground economy. As traditional jobs become scarce and entrepreneurial start-ups increasingly hindered by red tape, how much new economic activity is “off the books?” Again, a topic for another time.
Other Economic News this Week:
The Econintersect economic forecast for December 2012 shows weak growth. The underlying dynamics continue to have a downward bent. There are recession markers still in play, and one of our alternate methods to validate our forecast is recessionary. All in all, not a great forecast – but not one which would cause you to jump out the nearest window either.
ECRI believes the recession began in July 2012. ECRI first stated in September 2011 a recession was coming . The size and depth is unknown. The ECRI WLI growth index value is enjoying its thirteenth week in positive territory (but at a ten week low this week). The index is indicating the economy six month from today will be slightly better than it is today.
Current ECRI WLI Growth Index
Initial unemployment claims fell again from 410,000 (reported last week) to 393,000 this week. No Hurricane Sandy effect in this week’s data. Historically, claims exceeding 400,000 per week usually occur when employment gains are less than the workforce growth, resulting in an increasing unemployment rate (background here and here).
The real gauge – the 4 week moving average – rose significantly from 396,250 (reported last week) to 405,250. Because of the noise (week-to-week movements from abnormal events AND the backward revisions to previous weeks releases), the 4-week average remains the reliable gauge. This is the highest 4 week average in over one year, and is up 3.3% year-over-year.
Weekly Initial Unemployment Claims – 4 Week Average – Seasonally Adjusted – 2010 (blue line), 2011 (red line), 2012 (green line) 
Bankruptcies this Week: Dewey & LeBoeuf, Safeguard Security Holdings
Data released this week which contained economically intuitive components (forward looking) were:
- Rail movements (where the economic intuitive components indicate amoderately slightly expanding economy).
- Personal income fell again this month.
All other data released this week either does not have enough historical correlation to the economy to be considered intuitive, or is simply a coincident indicator to the economy.
Click here to view the scorecard table below with active hyperlinks.