Making sense (cents) of US Dollar by utilizing harmonic patterns offers targets, important support and resistance regions and risk parameters. Looking at the weekly chart offers a longer term view of what is formulating in the world of harmonics which in turn helps one determine which Fibonacci Ratio is important in a particular rotation as well as offer insight to price action.

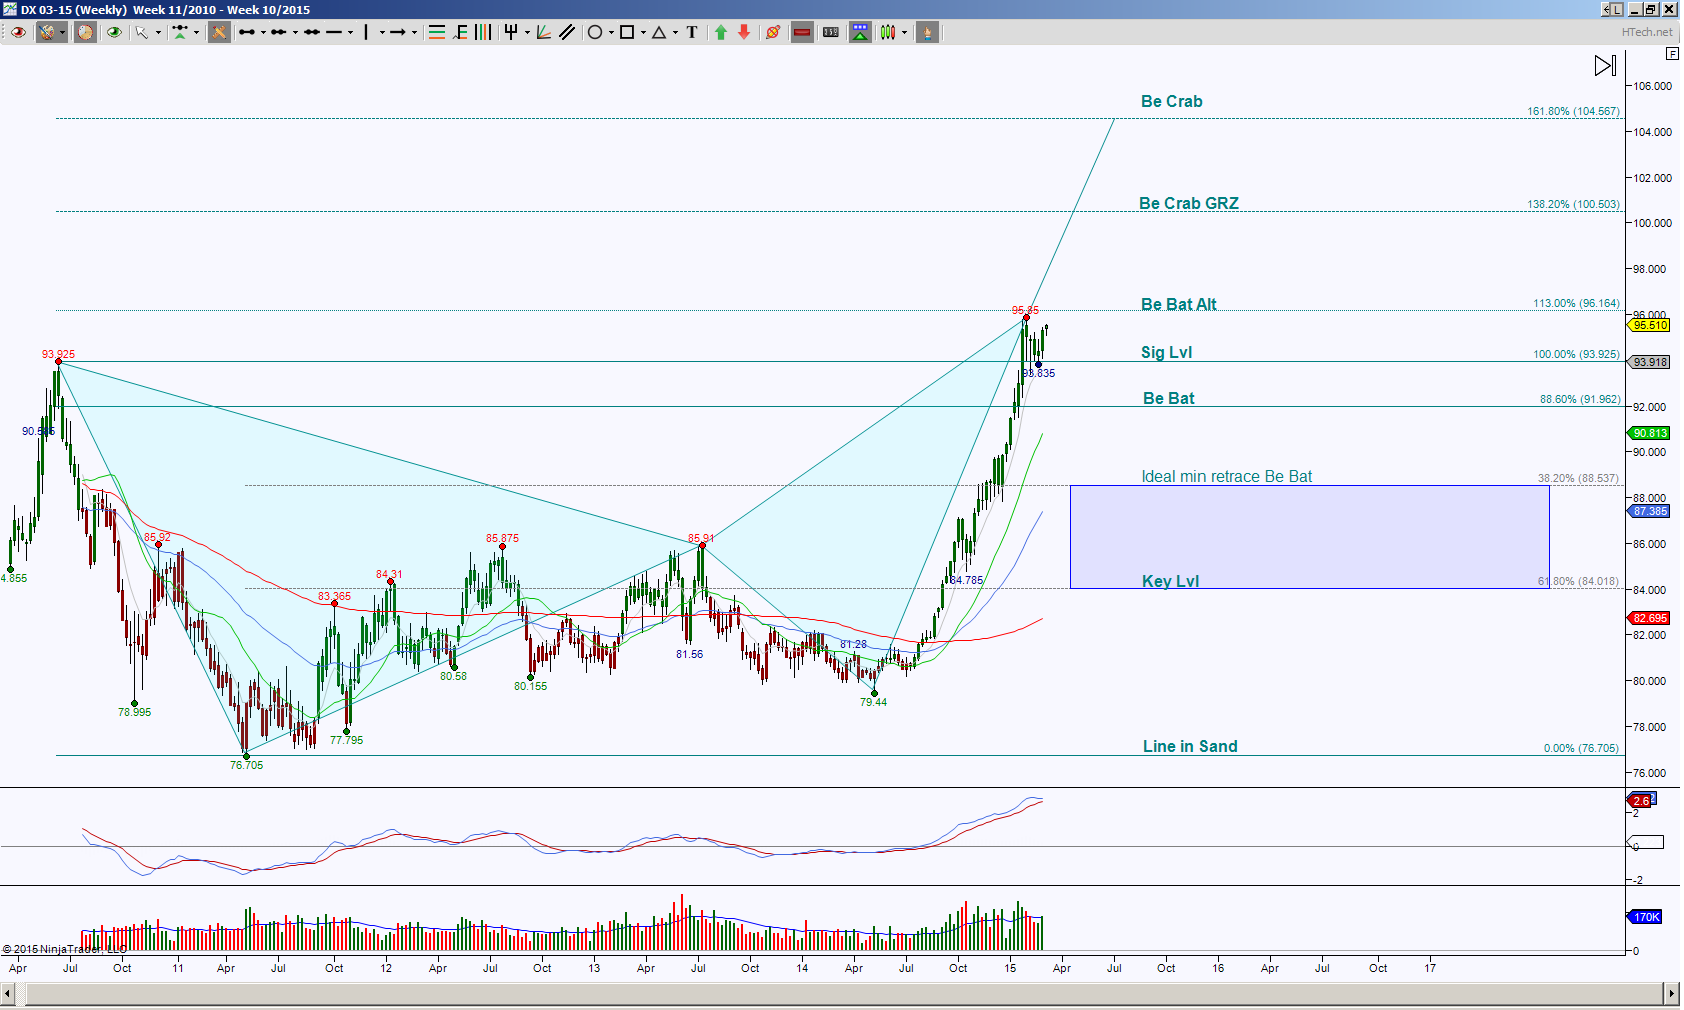
This week chart shows price is currently testing a PRZ (Potential Reversal Zone aka a completion target for a harmonic pattern) at 96.164. Since this is a double top region, a reversal there offers minimal risk for a possible reversal, however, a more conservative trader could wait for price to actually retest 95.85 to 96.164, convergence, or a confirmation of a rejection. This particular chart does show upside strength but clearly stalling.

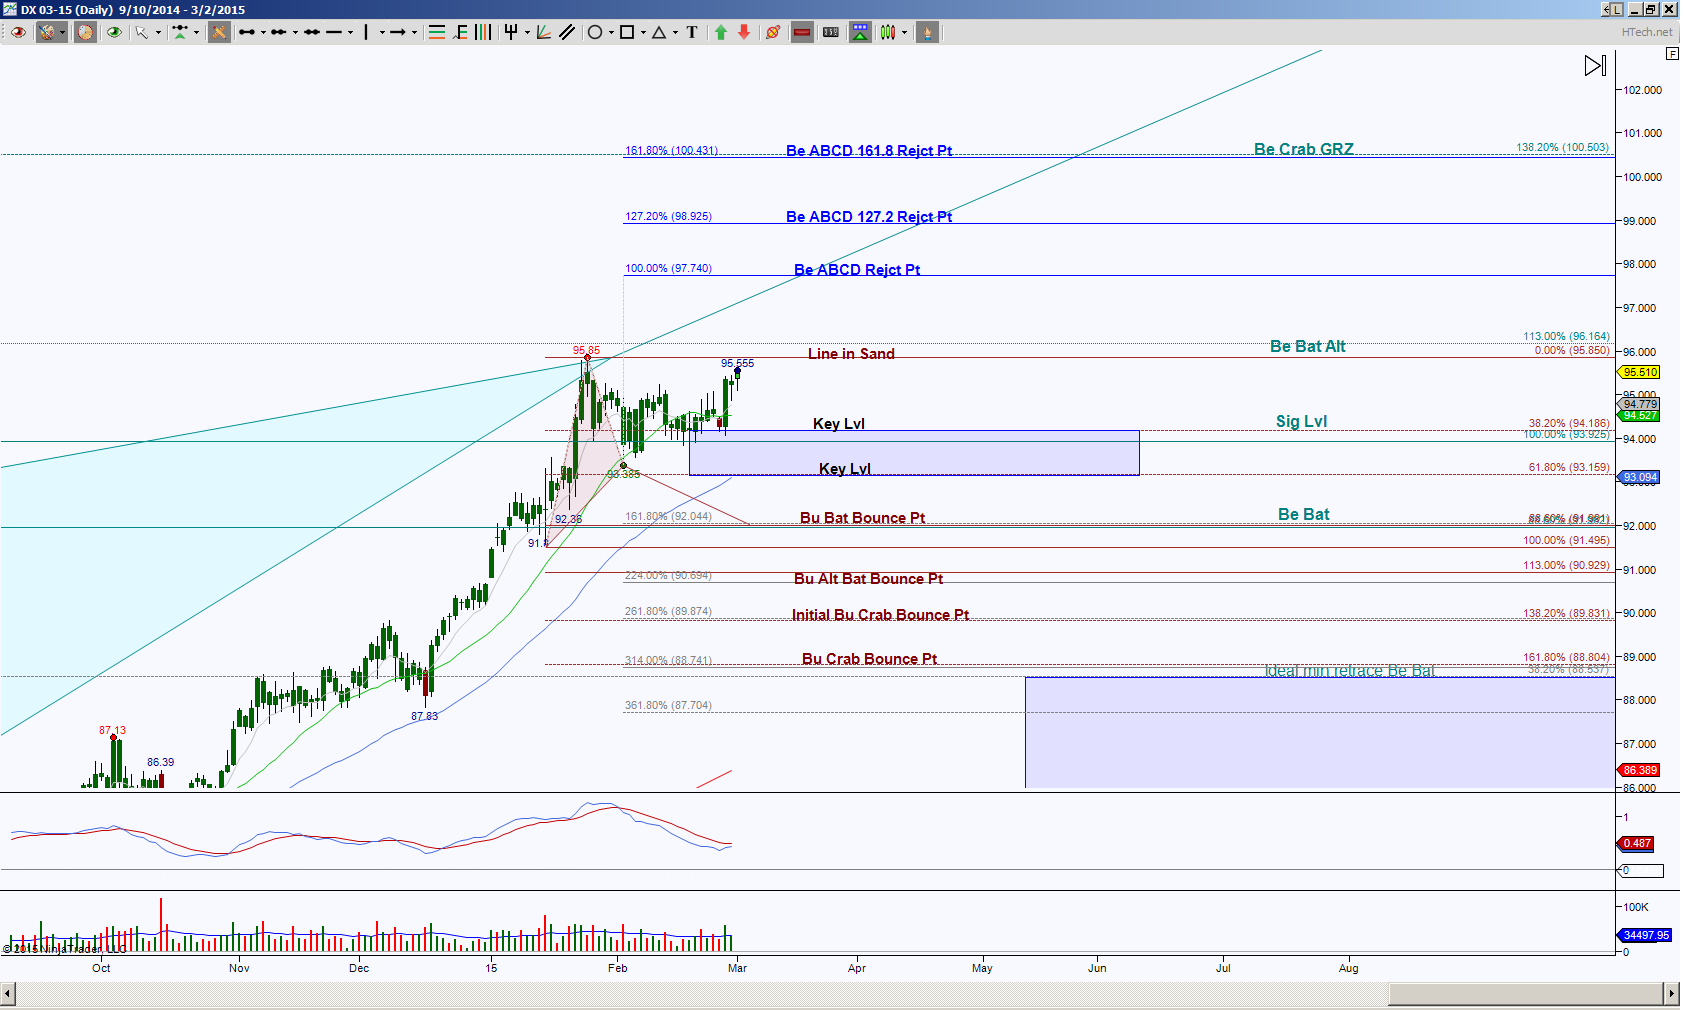
Looking at a day chart shows price is in between opposing emerging patterns, this is indicative of being in consolidation or rest period. For a swing trader that wants confirmation, this chart can offer a zoomed in look to see what needs to break and hold initially. In this case, the initial levels to break and hold are either 95.850 or 94.186. An upside hold has 97.740 first target and would wipe out the opposing brown colored Bat. Upside continuation has the ideal target of the weekly level 100.503 which does have convergence with this chart’s ABCD 161.8 target of 100.431. This behaves like a magnet as well as a very strong resistance test target.
A downside break has a target of 92, again this is a convergence area, but keep in mind that 93.159 is a very important directional bias level for this timeframe. It’s one thing if price breaches below 93.159 to complete the Bat, it’s another thing if that’s all we get and price holds back above 93.159. This would suggest the upside bias still in tact. Take note that the week chart shows an ideal minimum retracement target of 88.537 and should there be downside continuation below 91.991, then the extended ideal target is 88.804 to 88.741, this will place price ever so close to that retracement target.

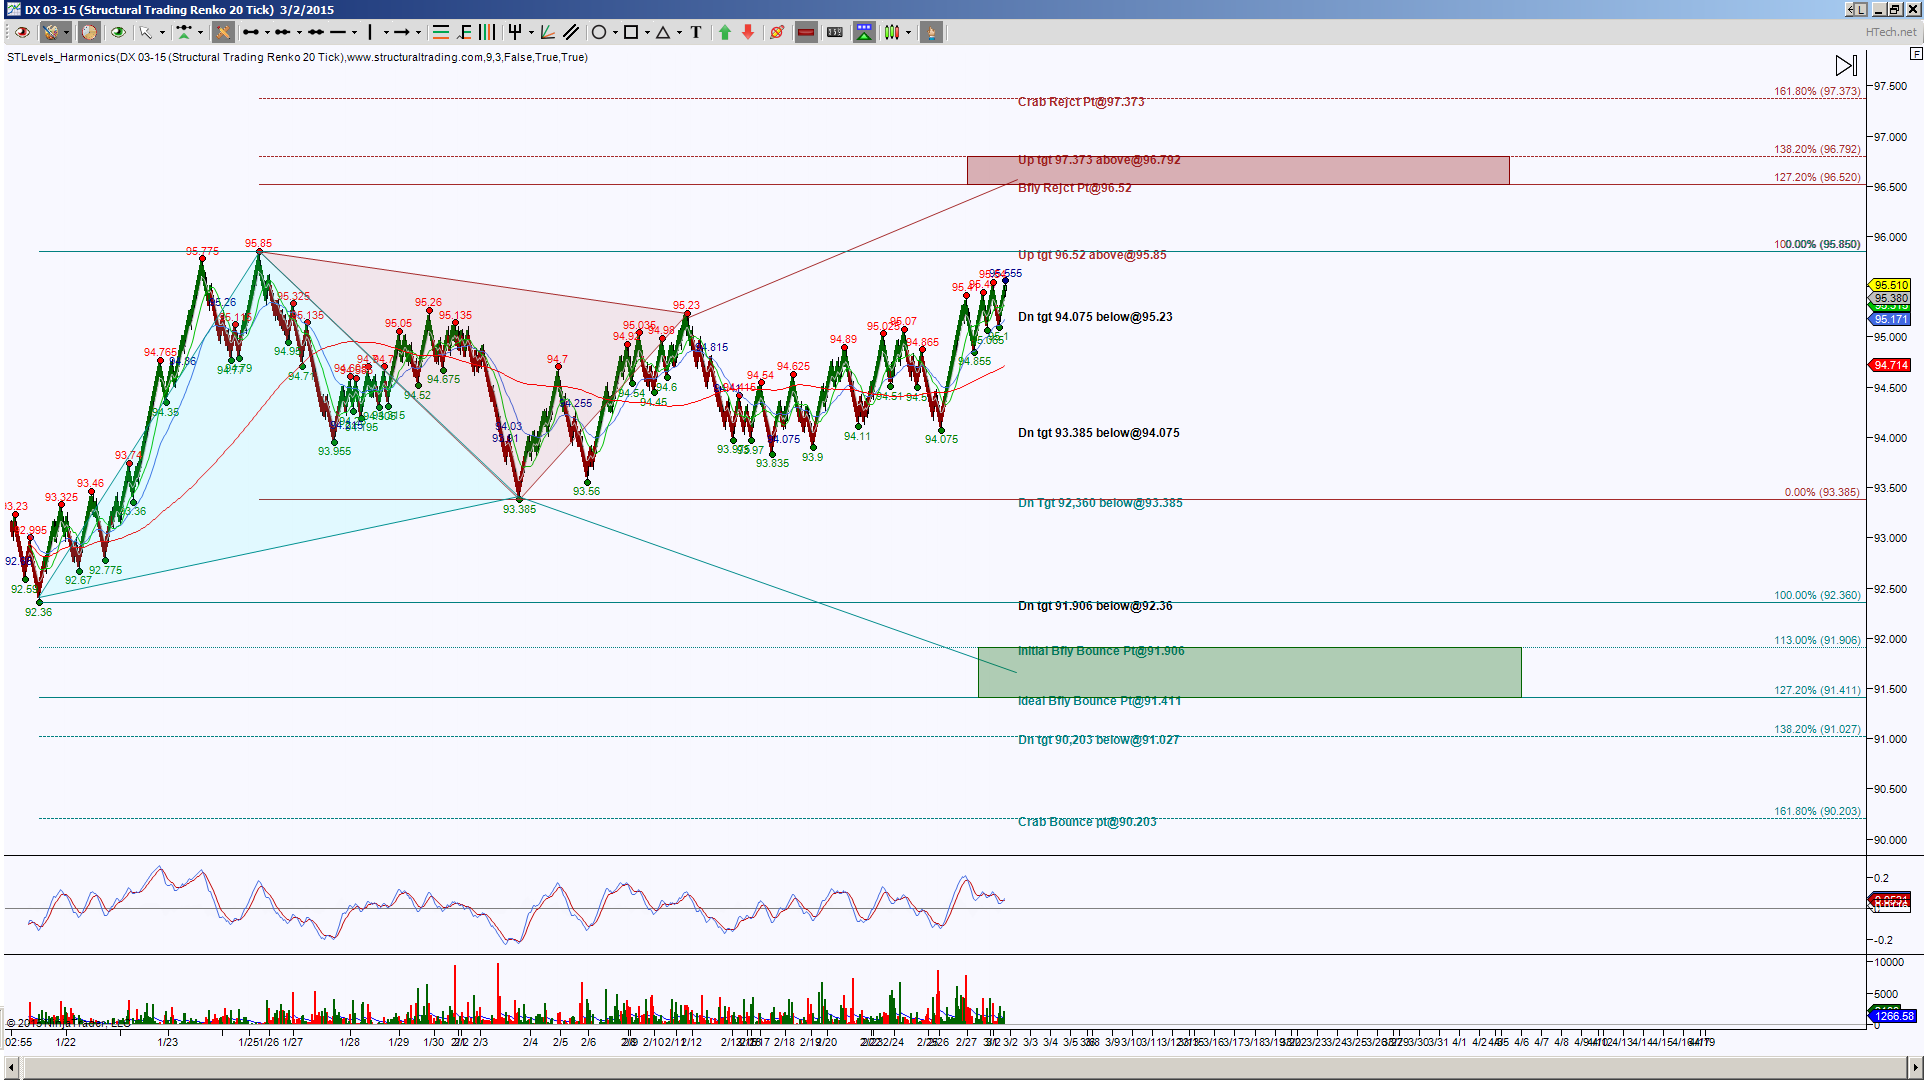
And finally for the day trader, I’m using an STRenko 20 bar. This chart shows that as long as price holds above 95.23, then the target to complete this emerging pattern is 96.52. Note this will help price breach that line in the sand and double top level of 95.850. This particular chart has an upside bias unless price can initially hold below 95.23 and more importantly below 94.075, if so then note how this Butterfly PRZ, 91.906 to 91.411, places price at a convergence level from the day and week chart. Harmonics are fractals so this doesn’t surprises me but always puts me in a place of awe.
Trading involves substantial risk and is not suitable for all investors. Past performance is not indicative of future results.
