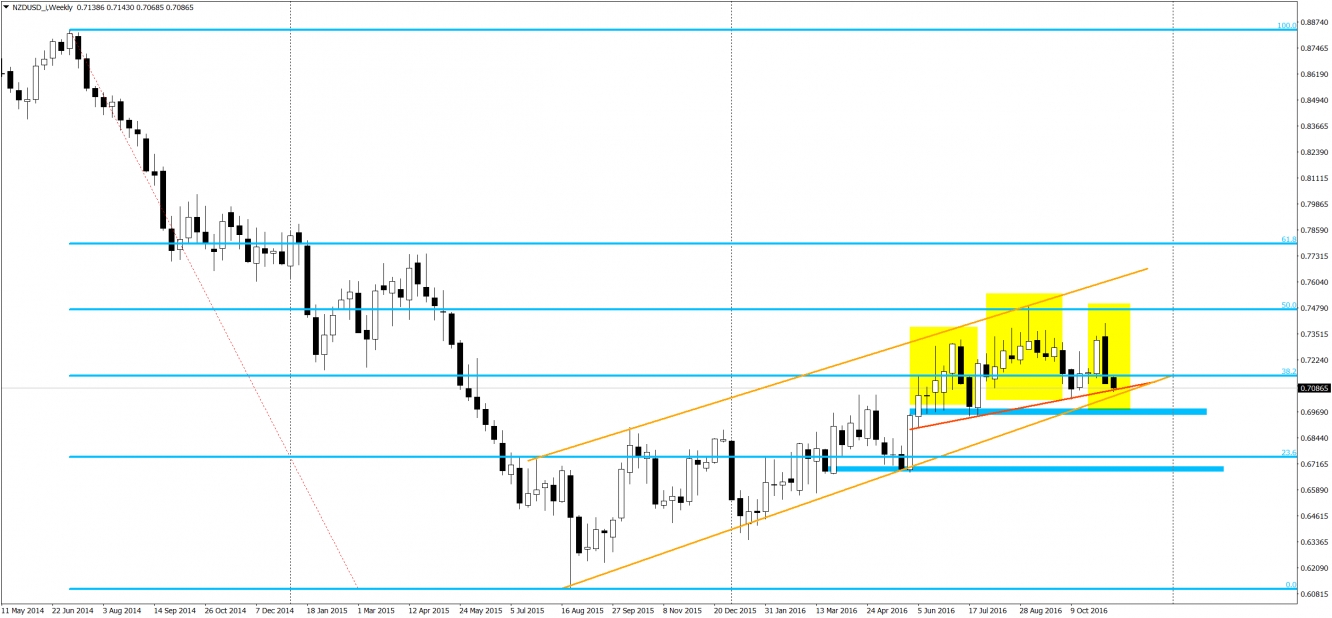
It is the USD's time. The rally after the elections was strong and meaningful for the long term situation of the FX market. It enabled an interesting trading opportunity on the NZD/USD. Here, we are still in the long-term downtrend which stopped in August 2015, for the correction. Buyers managed to retrace the 50% of the bearish wave and it looks like that is all, at least for now.
In the chart below, we have highlighted the Head and Shoulders formation using the yellow color. This is a trend reversal pattern and is located at the end of the flag. But the flag is a trend continuation pattern so what is the outcome of this situation? Well, H&S ends the midterm bullish correction and flag shows us a correction of the long term downtrend. That indicates that the downtrend should be continued.
That is the theory. What is more, sell signal are not yet activated. For that, we need to see a breakout of the neck line (red). It would be also nice to see the breakout of the lower line of the flag as well as a horizontal support around the 0.6970.
There is also something for the candlesticks fans. On a weekly chart, right shoulder of the H&S formation is created with a bearish engulfing. When we sum up all the checkpoints, further downswing seems more probable.

