When we look at our Risk Tolerance Threshold Ratio for gold — below – we see that even when we count the Grand Pattern, which we do not consider a “tradable” pattern because it is so long-term — call it an investment pattern — we have the majority of patterns down. It is ominous that the most influential pattern from the trader’s perspective — the Day to Day Pattern — has remained stubbornly lower since early November.
Gold Futures Jan, 4th, 2013:
- M Grand Up
- W Primary Up
- W S-primary Down
- D Secondary Up 1620
- 240 Day to Day Down
- 60 Micro Down
- 15 Micro Down
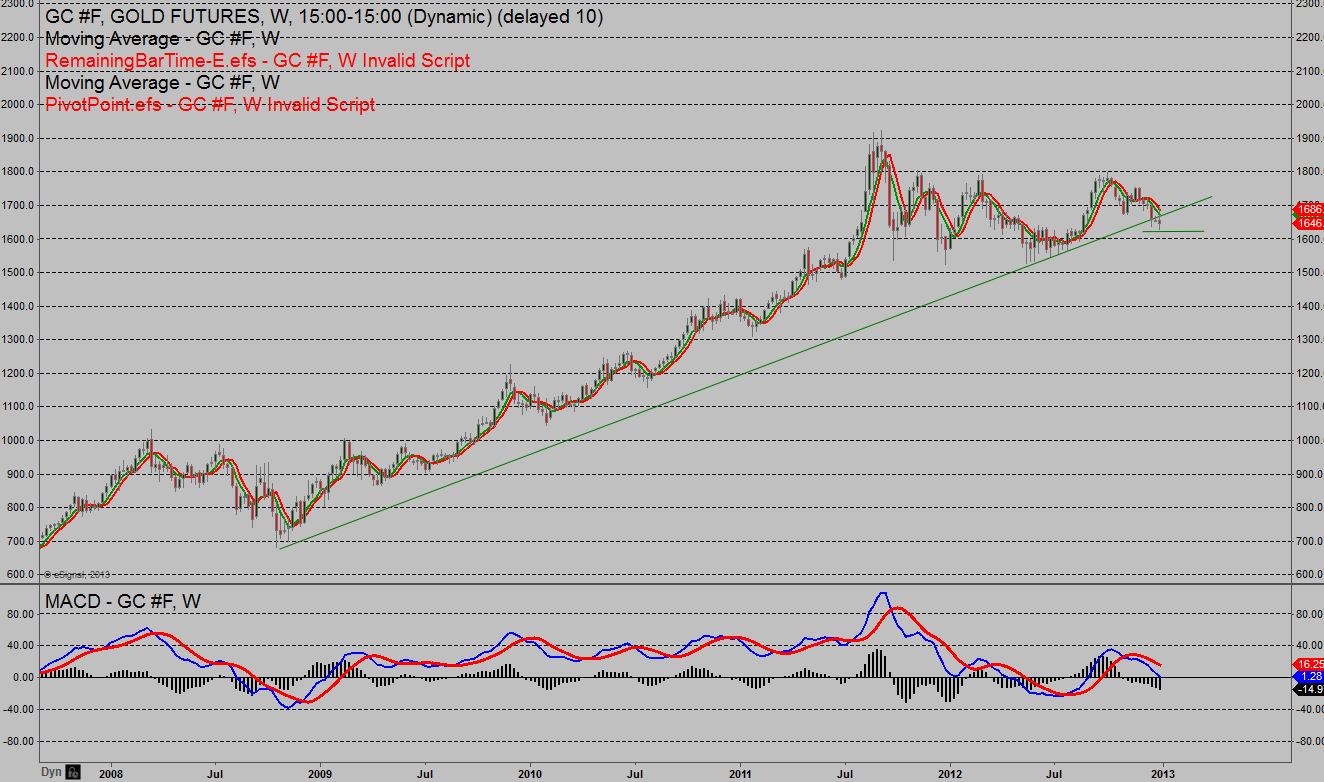
Our 2013 thesis for commodities is a return to two-way trade, which our Risk Tolerance Threshold Ratio for Gold and the weekly chart confirm by way of a lower high in 2012 to the all time high in 2011 — see Figure 1.
What this means for gold investors is more patience. What this means for traders and investors, who wish to add gold, again patience, and buying weakness, i.e.: going against the grain for trend traders. If the 1,620 level does not hold we would look for a sweep of the $1,500 level to knock out long-term holders and set-up the next intermediate-term bull leg.
Figure 1. Weekly Gold Chart
Disclosure: Jay Norris is the Director of Education at Trading University and a Market Strategist at EosTrade.com
Trading is a risky endeavor and not suitable for all investors.
