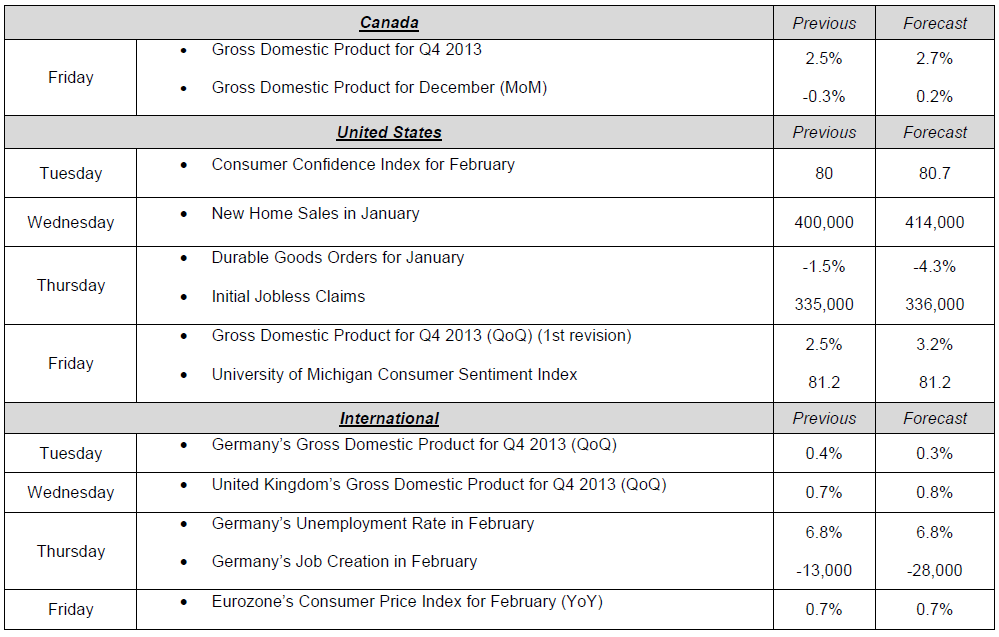
Two Canadian indicators released last Friday caught our attention. First, Retail Sales data were quite a disappointment, down -1.8% in December, i.e. 1.4% less than expected. Then, in contrast, economists had expected a 0.1% increase in the inflation rate in January, but instead it rose by a surprising 0.3%. In the U.S., the 880,000 housing starts announced on Tuesday fell considerably short of analysts’ forecast of 950,000. On Wednesday, the publication of the FOMC Meeting Minutes did not have any significant impact on the markets when we learned that the Fed’s tapering of QE3 bond purchases would carry on. The Committee also stated that it was currently considering a new threshold for an eventual increase to the Federal Funds Rate (Key Rate), to replace the former target of 6.5% unemployment rate. Have a good week!

The Loonie
“Reality is merely an illusion, albeit a very persistent one.” - Albert Einstein While the loonie continues to trade around the level last seen over four years ago, questions pertaining to the driving force behind the current valuation remain. Whilst there are a number of economic variables that can be used to evaluate recent depreciation, this analysis will focus on energy prices and its influence on the performance of the Canadian dollar. According to Bank of Canada publications, ‘’in 2000, energy made up 11 per cent of Canadian exports. Today it is almost 20 per cent. Oil is now by far Canada’s most important commodity. It’s share of commodity production roughly doubled in the past decade, to close to 50 per cent today.’’1 Considering Canada’s reliance on energy production, it is important to examine if prices on oil and natural gas could have played a key role in the loonie’s downfall. According to the monthly correlation matrix (on the right), between June 2010 and February 2014, CADUSD and CLA (oil contract) have had 67.1% positive correlation.
To Read the Entire Report Please Click on the pdf File Below
