We have a busy week ahead in terms of economic data from the U.S. and abroad. Much like the last few weeks, this is sure to be another week in which the markets closely track news originating in the Euro zone. But the U.S. also is attracting everyone’s attention, since a deadline is fast approaching to identify some $1.2 trillion in spending cuts to be made over a 10-year period. Should the “super committee” prove unable to reach an agreement by Tuesday, November 22, cuts will be automatically triggered in domestic and defence programs for 2013. Such developments will surely create turmoil in the stock markets. In economic news, we can expect the following:
Canada
The Canadian economic calendar is very thin this week. On Monday, wholesale sales data will be released for the month of September. This may be seen as a leading economic indicator for the retail sales industry. Data on retail sales will be released on Tuesday morning. The consensus is that it will be 0.5%.
United States
Several economic figures are expected south of the border. They will indicate whether a recovery of the American economy will be possible at any time soon. The U.S. GDP figure will be released on Tuesday. Analysts expect this quarterly figure to be 2.5% on an annualized basis, or unchanged from the previous quarter. Also on Tuesday, we can expect the minutes of the Federal Reserve’s meeting that took place on November 1 and 2 to be released. Investors will be weighing each word to try and predict what measures the Fed will adopt. The market expects orders for durable goods to be down 1% on Wednesday. Another significant piece of news on Wednesday will be the University of Michigan’s consumer confidence index. Thursday is American Thanksgiving, a national holiday.
International
The flow of global economic data begins on Tuesday with the consumer confidence index for the Euro zone. It continues on Thursday with GDP data for Europe and Great Britain. Data on inflation in Japan is also expected on Thursday. Have a good week!
The Loonie
A breath of fresh air?
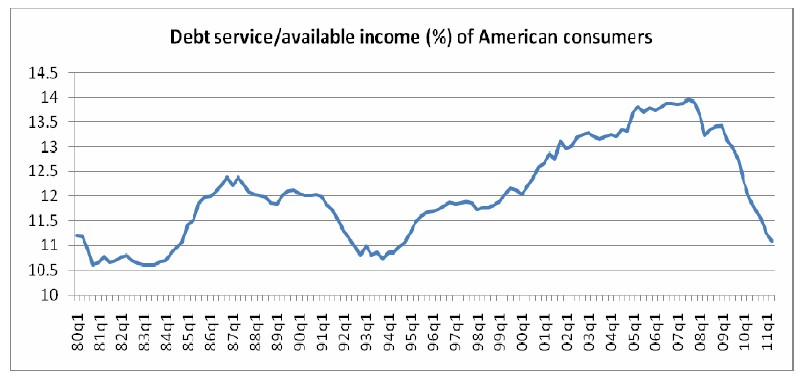
In an environment where dark news from Europe is filling the air waves, it is interesting to note that a ray of hope may be found in the United States. Indeed, the American consumer seems to be a little better. Last Friday, the Conference Board released its leading indicators index, which recorded its sixth consecutive increase (0.9%) in October. The index includes items such as new orders, jobless claims, money supply, average weekly hours and building permits. Its purpose is to indicate changes in the direction of the economy and although we should be careful when interpreting measures taken individually, it is typically positive when going out of recession and plunging when dark clouds are approaching. Interestingly, the components behind the surge in October are relating to employment and especially, residential building permits. Moreover, weekly jobless claims have reached a seven-month low last week. The good news is that we are touching here the heart of the U.S. economy, the consumer. To say that he is solicited during the holiday season is an understatement... but can he answer the call? To answer this question, we must also take a look at personal debt; it was, after all, the trigger for the crisis. The Federal Reserve Board assesses the level of debt service (minimum payment) in relation to personal disposable income of households as far as our southern neighbours are concerned.
In 2007, just before the crisis, a decade of aggressive credit had pushed the index close to 14%, its historic high of 30 years, while it oscillated between 10% and 12.5% during the 1980’s and 1990’s. Today, debt service has returned to a level of 11% of available income, a level unseen since 1994. In the turmoil, decline in debt, stabilization of employment, and new construction, are glimmers of hope for American manufacturers and retailers, as well as their Canadian suppliers.
Last Week at a Glance
Canada – In October, headline CPI decelerated to 2.9% year over year from 3.2% in September. Core CPI slipped to 2.1% from 2.2%. On a monthly basis, headline CPI rose 0.2% after increasing by as much the month before. Core prices jumped 0.3% after springing 0.5% the previous month. On a seasonally adjusted basis, total and core CPI advanced 0.3% and 0.2%, respectively, month over month. Five of eight major components were up on the month (s.a.), led by transportation (+1.3%) and shelter (+0.6%). Declines were observed in recreation, education, and reading (-0.2%) as well as alcoholic beverages and tobacco products (-0.1%). Although the annual inflation rate eased in October, the underlying trend was not reassuring. Despite relatively steep price hikes over the past four months in the purchase, leasing, and rental of passenger vehicles and in electricity, the base effect from last year contributed to the lower inflation reading in October. Since June, only three of the eight broad components of the CPI have had inflation below the Bank of Canada’s target midpoint. This suggests that the upward pressure on prices is emanating from several sources. In September, Canadian factory shipments rose 2.6%, double the consensus forecast. The 13.7% increase in petroleum and coal products was the main driver, but there were decent gains in several other sectors as well, including transportation equipment (+7.1%). Ten of the 21 industries saw increases. In volume terms, shipments were up 1.8%. The inventory-to-sales ratio sank to 1.3, a third consecutive decline, which bodes well for future production.
United States – In October, the consumer price index dipped 0.1% from the previous month. Energy (-2%) was a key driver, as gasoline prices fell. Food prices cooled (+0.1%) after a string of hot months. The monthly drop in the headline CPI brought the annual inflation rate down four ticks to 3.5%. Excluding food and energy, prices edged up 0.1%, taking the year-on-year core CPI up a notch to 2.1%. On a 3-month annualized basis, core CPI was running at 1.75%, its slowest pace since January. Motor vehicle prices retreated for a second month in a row, as shortages eased after production was disrupted earlier this year. There was softness in the prices of other items as well, including computers and recreation. Price pressures moderated in the United States as core producer prices were flat for the first time since November 2010. Again in October, retail sales proved stronger than expected, shooting up 0.5% overall from the preceding month. Excluding spending on the more volatile segments of gasoline and cars, retail sales grew a robust 0.7%. Still in October, industrial production progressed 0.7% after a revised contraction of 0.1% in September (originally reported as a 0.2% gain). A surge in auto production (3.1%) and mining output (2.3%) contributed to the strong report. Housing starts fell marginally to 628,000 units in October from their downwardly revised pace of 630,000 in September. Building permits in the month jumped 10.9% to 653,000, their highest level since March 2010 when a homebuyer tax credit helped boost housing activity.
Euro area – The flash estimate for Q3 GDP showed a 0.6% annualized increase for the euro area. France and Germany grew at an annualized pace of a less than 2%, while Spain was flat. It should be noted that the flash estimate covers only 80% of the area’s 17 member nations. Italy, which registered the steepest plunge in industrial production of the lot in September, has yet to release its GDP figures. Consequently, once Italy included, the euro area’s growth rate should prove even weaker. The Q3 handoff was particularly poor, as real retail spending and industrial production shrank 0.7% and 2%, respectively, in September. With more austerity measures on the euro area’s horizon, the outlook remains bleak.
Technical analysis: USDCAD and GOLD (Friday November 18, 2011 )
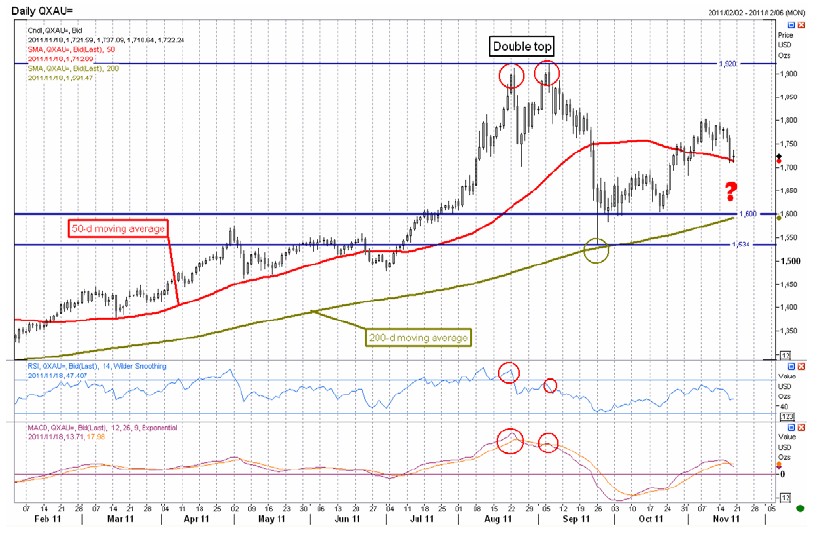
USDCAD: No clean break of the resistance at 1.0264. Rates went higher during trading, but nothing definitive. It should be recalled that surpassing this level would validate the Head & Shoulder pattern, with an objective of 1.0640. More on this next week. GOLD: Gold is said to do well in periods of political or financial uncertainty. Gold is also said to rise during inflationary periods. Let us see what the charts have to say. On top, daily data on the price of gold / -Below, 2 oscillators: RSI and MACD. The long-term trend, seen in the monthly data, continues to rise. The short-term trend is in doubt since the double top of late August and early September. The RSI and MACD very clearly show a bearish divergence, since they do not confirm the second top (red circles). The decline that followed went as far as the 200-day moving average, which is a major support (green circle). Gold has since returned to below its 50-day moving average, which now acts as a support. The RSI and MACD do not indicate a continued increase but rather a new decline toward 1,600, the new 200-day moving average. The bullish trend should therefore return, except if we go below 1,534. In summary: we expect gold to drop toward 1,600, levels at which it would be a good buy. Beware of anything under 1,534.
Commodities
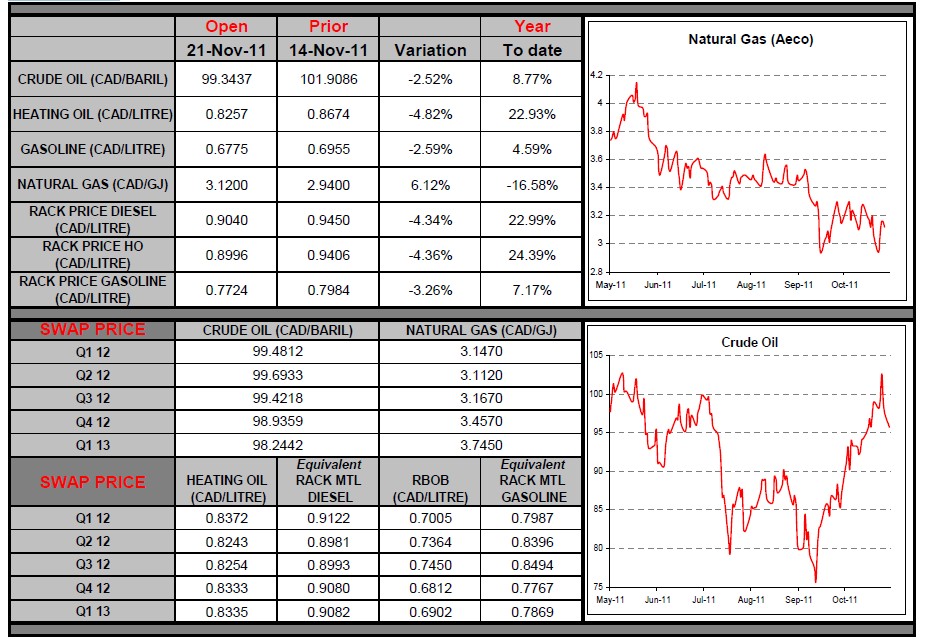
Undoubtedly, the biggest event in commodity markets this week was the surge in WTI prices, which briefly rose above $100 after Enbridge announced that it would reverse the flow of oil in its Seaway pipeline in order to send crude from Cushing, Oklahoma down to the Gulf of Mexico. This will reduce inventories at Cushing, where they had begun to rapidly accumulate over the last few months. Since WTI serves as the reference index at this point of delivery, its price is on the rise. On the other hand, diesel and heating oil prices eased somewhat during the week following sharp increases over the last month. With a bit of luck, the correction may continue, opening up good opportunities for companies looking to cover their exposure to diesel in 2012. Have a great week!
- English (UK)
- English (India)
- English (Canada)
- English (Australia)
- English (South Africa)
- English (Philippines)
- English (Nigeria)
- Deutsch
- Español (España)
- Español (México)
- Français
- Italiano
- Nederlands
- Português (Portugal)
- Polski
- Português (Brasil)
- Русский
- Türkçe
- العربية
- Ελληνικά
- Svenska
- Suomi
- עברית
- 日本語
- 한국어
- 简体中文
- 繁體中文
- Bahasa Indonesia
- Bahasa Melayu
- ไทย
- Tiếng Việt
- हिंदी
Major News this Week
Published 11/22/2011, 06:28 AM
Updated 05/14/2017, 06:45 AM
Major News this Week
Latest comments
Loading next article…
Install Our App
Risk Disclosure: Trading in financial instruments and/or cryptocurrencies involves high risks including the risk of losing some, or all, of your investment amount, and may not be suitable for all investors. Prices of cryptocurrencies are extremely volatile and may be affected by external factors such as financial, regulatory or political events. Trading on margin increases the financial risks.
Before deciding to trade in financial instrument or cryptocurrencies you should be fully informed of the risks and costs associated with trading the financial markets, carefully consider your investment objectives, level of experience, and risk appetite, and seek professional advice where needed.
Fusion Media would like to remind you that the data contained in this website is not necessarily real-time nor accurate. The data and prices on the website are not necessarily provided by any market or exchange, but may be provided by market makers, and so prices may not be accurate and may differ from the actual price at any given market, meaning prices are indicative and not appropriate for trading purposes. Fusion Media and any provider of the data contained in this website will not accept liability for any loss or damage as a result of your trading, or your reliance on the information contained within this website.
It is prohibited to use, store, reproduce, display, modify, transmit or distribute the data contained in this website without the explicit prior written permission of Fusion Media and/or the data provider. All intellectual property rights are reserved by the providers and/or the exchange providing the data contained in this website.
Fusion Media may be compensated by the advertisers that appear on the website, based on your interaction with the advertisements or advertisers.
© 2007-2025 - Fusion Media Limited. All Rights Reserved.
