Again this week, fears from Europe will monopolize investors’ attention, overshadowing the release of economic figures. After the sharp rise in Greek yields over the last two years, everyone’s attention has turned to the rising cost of financing in Italy, suggesting a stressful year-end for financial markets. Given the fact that Italy has the third largest economy in the eurozone and a total debt of 2.6 trillion euros, it would appear impossible to implement a bailout plan like the one proposed for Greece. For this reason and considering the scope of the problems for the entire region, it would appear that the worst of the crisis is yet to come. Here follows a synopsis of the main economic news for the week in Canada, the United States and internationally.
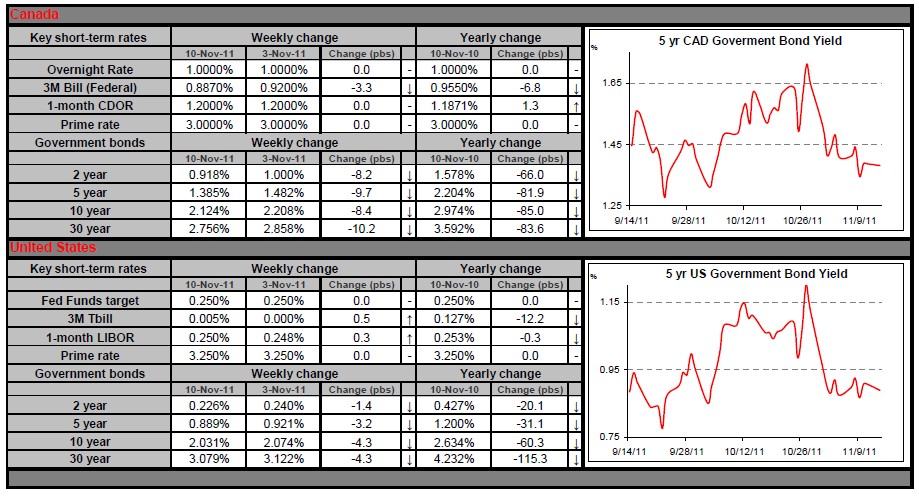
Canada
Little news is expected this week in Canada. We will be watching Manufacturing Sales on Tuesday and Canada’s International Transactions in Securities on Thursday. Friday will be busier, with the release of Consumer Price Index (CPI) and Leading Indicators data. Given that the Canadian economy is still far from having reached its full potential, the lid will be kept on inflationary pressures over the next few months.
U.S.
The economic calendar is quite different south of the border, where we can expect several major indicators. First, data will be released on retail sales and the Producer Price Index on Tuesday. This will be followed by the latest data on the Consumer Price Index at 8:30 am on Wednesday. Since capacity utilization is still far from the 81.3% peak recorded in September 2007, U.S. inflation data will have little impact on financial markets. Lastly, close attention should be paid to the Leading Indicators, which are expected on Friday at 10:00.
International
We will begin the week monitoring data on industrial production in the Euro zone, to be released on Monday, and statistics on GDP growth in Germany and France, on Tuesday. Lastly, we will be watching for data on inflation in the eurozone and retail sales in England. Despite the release of these data, investors around the world will be watching changes in the yields paid on Italian, Greek, Spanish and Portuguese bonds. Have a good week!
The Loonie
“History is the sum total of things that could have been avoided” Konrad Adenauer
Once again last week, investors were transfixed by events in Europe. With no time to relax after the terms of departure of Greece’s former Prime Minister, George Papandreou, were announced and a successor, Lucas Papademos, was named, the market immediately singled out Italy, the next country on the list. If Greece served as a dress rehearsal, then Italy represents a grand performance. One way to measure the level of risk that one country represents to the other members of the eurozone is to add up the public and private debt held by foreign investors. By this measure, Greece’s sovereign debt represented a net exposure of $127 billion. Over the last few months, we have seen the extent to which this relatively small amount could have an enormous influence over financial markets. Well, Italy now represents a net exposure of some $832 billion. The country’s total debt is almost $2,600 billion, or close to 120% of its annual gross domestic product. Now if you add the fact that from 2001 to 2010 Italian economic growth lagged behind all other countries except Haiti and Zimbabwe, you begin to understand that we have just entered very choppy waters.
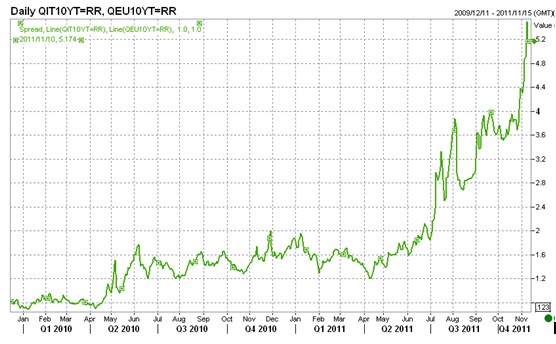
The above graph provides a striking illustration of both investors’ growing worries and the problems that Italians will be facing over the next few months. The black line represents changes in yields on the European Union’s 10-year bonds, while the blue line shows yields on 10-year bonds issued by Italy over the same period. The green line in the graph on the right represents the spread between yields on Italian bonds and their European equivalents. In other words, the green line illustrates the level of confidence that markets have in Italy on its ability to honour its obligations. With a spread of 5.2%, we now find ourselves with the largest interest rate differential in the last decade, and there’s the rub; just as Italy is pulling out all the stops to trim its deficit, its interest expense will continue to consume an ever larger share of the annual budget, effectively driving up the deficit. This situation is creating an increasingly nervous and volatile global environment for the Canadian dollar. Such an environment does not usually favour our loonie, but rather safe havens such as the U.S. dollar and precious metals.
Last Week at a Glance
Canada – In September, Canada’s merchandise trade balance was back in the black for the first time since January, pegging in at C$1.25 billion. Consensus expectations were for more red ink. Moreover, a revision of the previous month’s numbers saw the August deficit contract slightly. Contributing to this surprising return to surplus was a surge in exports (+4.2%) and a simultaneous retreat in imports (-0.3%). Energy was the big driver behind the advance in exports with an 11.3% increase. However, decent gains were posted by other sectors as well, including autos, forestry, agricultural products and industrial goods and materials. These more than offset a pullback in machinery and equipment. In real terms, exports climbed 1.2% while imports fell 1.9%. Unlike in Q2, trade is set to contribute positively to GDP in Q3 thanks to an 18% annualized increase in export volumes on the quarter. The 11.5% decline in real imports of machinery and equipment heralds a decrease in business investment in Q3. This development is not surprising given the preceding quarter’s unsustainably hot pace. Looking ahead to Q4, some sectors of the economy have a good deal of catch-up potential. Production and real imports of autos bounced back strongly in Q3, but these were put in inventories as exports stagnated in the quarter. As a result, inventories are tracking at about 30% annualized growth in Q3. With solid demand for autos in the final quarter of the year (if U.S. October sales are any guide), expect these Canadian inventories to recede and auto exports to rise further. We saw a similar response in Q1 of this year following inventory accumulation the quarter before. Energy, too, has potential in the final quarter of the year, particularly given the partial rebound in Q3 (+11.4% after -22% in Q2). Hence, trade could provide some upside to Q4 GDP growth. In October, Canadian housing starts were down slightly to 207.6K from an upwardly revised 208.8K in September. This nonetheless beat consensus, which did not expect the month’s total to top 195K. The decline was driven by singles, which fell 6K to 60.9K. Multiples provided partial offset by increasing 2K to 123.6K. On a regional basis, in urban areas, Quebec and the Atlantic region posted the biggest drops. Also, recent labour market trends suggest that disposable income, which flat-lined in the first half of the year, should not improve much going forward. This will somewhat counteract the positive impact of low interest rates on the housing market. In the Update of Economic and Fiscal Projections presented this past week by Finance Minister Jim Flaherty, growth expectations for Canada were revised down for the near term, compared with the assumptions underlying the June budget. In general, economists now see the domestic economy expanding 2.1% in 2012, down from 2.8% earlier this year. Not only did the Finance Minister take note of this, but in light of the heightened risks to the economic outlook related to external factors, the government has made additional provisions for a cumulative $6.0 billion to account for risks to revenues over the next three years. Consequently, the deficit pattern is now somewhat higher than was projected in June. Still, considering the savings targeted by the Strategic and Operating Review, a small budget surplus of $0.6 billion is projected for 2015-2016. For the following year, a surplus of $4.6 billion is expected. By then, the debt-to-GDP ratio should reach 30.3%, which is 4.7 percentage points below the mark projected for fiscal 2012-13.
United States – In September, the trade deficit narrowed to $43.1 billion from a revised $44.9 billion in August. Exports grew $2.5 billion to $180.4 billion on the month (+1.4%), while imports swelled $0.7 billion to $223.5 billion (+0.3%). The better-than-expected trade data reflected stronger exports in consumer goods and industrial supplies. The real merchandise trade deficit shrank by slightly less than a $1 billion. All in all, the September data suggest trade will add about 0.5% to GDP in Q3. In October, the U.S. National Federation of Independent Business (NFIB) index of activity and sentiment rose to 90.2 after showing weakness during the summer months (88.1 in August). Though the index remains at a historically depressed level, the turnaround was nonetheless encouraging. Bank lending conditions remain favourable for U.S. businesses. Indeed, according to the Senior Loan Officer Opinion Survey on Bank Lending Practices, a majority of commercial banks maintained or eased lending conditions on commercial and industrial (C&I) loans in October. At this juncture, the fact that banks are both willing to lend and actually increasing their C&I loan book is a most positive outcome for the U.S. economy. This is a necessary condition (albeit not a sufficient one) to avoid an economic relapse.
Technical analysis: USDCAD, objective 1.0640?
I had mentioned several weeks ago the Head & Shoulder pattern (H&S) on the US S&P500 index. This pattern marked the top of the bullish rally at 1,370. We are now at 1,263 and the objective stays at 1,156.
We know that the correlation between the S&P 500 and the USDCAD is strongly negative. It would not be surprising to find the same type of pattern (inverted H&S) on the USDCAD that would signal a major bottom. The chart below shows exactly that! For the H&S to be activated, we need to see a significant break of the neckline. It was the case on the S&P500 but it still has to materialize on the USDCAD where the neck line sits at 1.0264 (green line). The spot rate this morning is at 1.0180. If 1.0264 is taken to the upside, the objective would be 1.0640, which is also 94 cents…What could be an interesting strategy?
Sellers: As long as 1.0264 is not breached, it would be prudent to continue to hedge short term needs. If 1.0264 is taken, leave orders in the 1.0500-1.0600 area. Buyers: As long as 1.0264 is not breached, a move back to parity is always possible. Leave stop loss orders around 1.0300.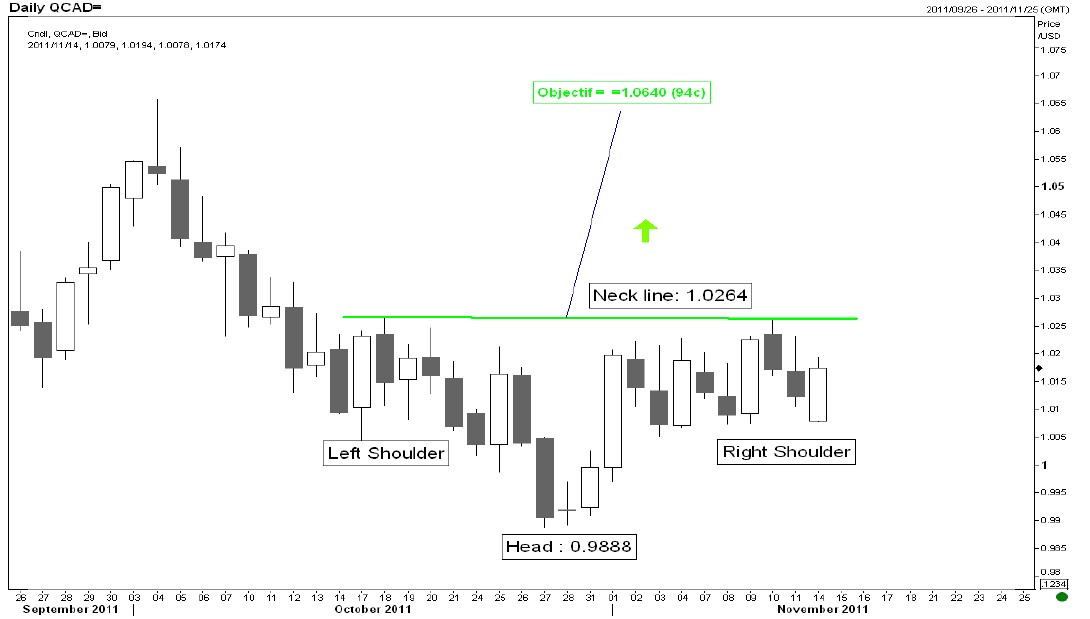
Commodities
Due to a sharp rise in WTI prices, the spread between WTI and Brent has narrowed to under $16/barrel. Oil prices fared very well once again this week—rising 2%—despite the market downturn during the same period. The release of figures on petroleum products, showing a decline in inventories, was well received by the markets. According to statistics from the Department of Energy, inventories of diesel and heating oil reached their lowest levels in almost three years. For that reason, diesel and heating oil prices reached new highs for the year. Given the poor growth outlook for the developed economies, the International Energy Agency (IEA) has scaled back forecasts of demand for petroleum products in 2012. Despite this small 20,000-barrel reduction, IEA expects 1.5% growth in global oil consumption, which should reach a new all-time high of 90.5 million barrels/day. According to figures released by BP, global oil consumption in 2007 was 86.4 million barrels per day and bottomed out at 84.7 million barrels in 2009.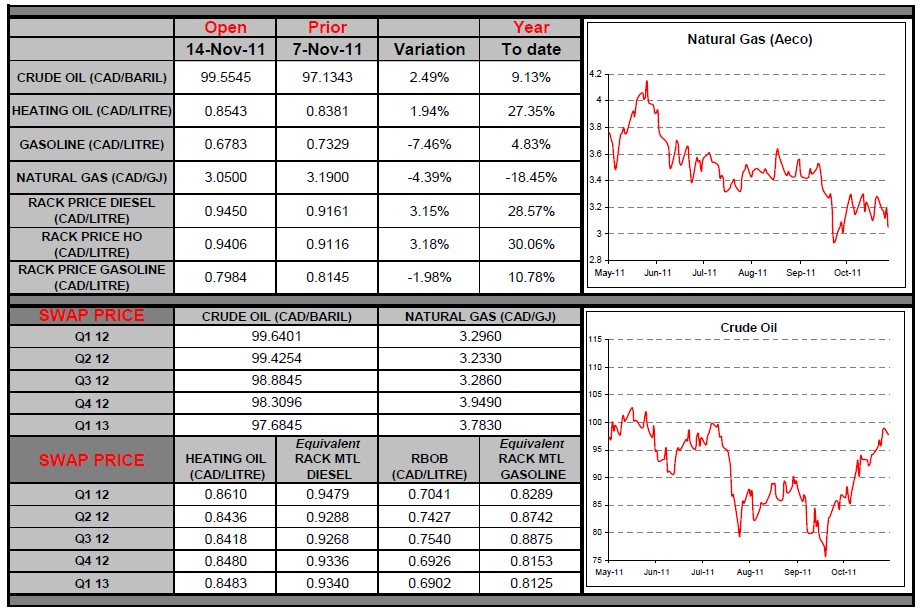
Fixed Income
Canadian government yields ended the week slightly lower, mainly in reaction to frictions on Western Europe’s economical,
political, and social scenes.
Key Highlights:
- Rates started on the rise early in the week, as a plan to reform the Italian government emerged and briefly encouraged traders. However on Wednesday, they started to doubt that a government restructuring would address the important fiscal issues faced by Italy. In search for safety, investors massively sold stocks and grabbed onto the safety of Canadian, US, and German government bonds.
- At home, the Canadian government planned a 2 year bond auction on Wednesday. The issue received a lot of interest indeed, and yields dropped as a result.
- It’s a challenge to find return on the bond markets nowadays, but some borrowers are taking advantage of the current turmoil to protect rates for 2 to 5-year periods, some even creating immediate savings for their organization. While we left for the long week-end, the Canadian swap curve was still discounting at least a full 0.25% rate cut in the coming months.
- Key economic indicators for the coming week include Canada’s manufacturing sales on Tuesday, as well as US and Canadian CPI numbers, respectively expected on Wednesday and Friday.