
 EUR/USD" title="EUR/USD" width="637" height="462">
 The pair rebounded with the start of today`s session, after fluctuating around 1.2750 level for a while. We have been calling for this bullish rebound, however a false breakout few pips below 1.2730 has prematurely invalidated our previous bullish scenario, as the pair rebounds again above the level. On the other hand, the bullish rebound hasn’t been confirmed yet, a break above the short term descending resistance and 1.2800 level again could be the first confirmation signal for this rebound. For now, we prefer to monitor price action for further confirmations.
The trading range for today is expected among key support at 1.2650 and key resistance at 1.2880.
The general trend over short term basis is to the downside targeting 1.1865 as far as areas of 1.3550 remain intact. 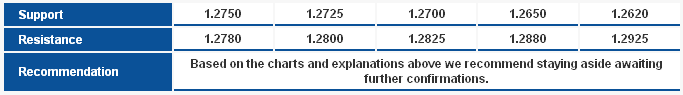 EUR/USD_S&R" title="EUR/USD_S&R" width="683" height="95">
GBP/USD GBP/USD" title="GBP/USD" width="637" height="462">
We mentioned previously that the price has been trading within a sideways bias, fluctuating among resistance and support levels. These conditions provide opportunities to long the pair on dips and short it on rallies, and that what we have done yesterday. Accordingly, the pair rebounded above 1.6000, and now, a push towards 1.6040 resistance could provide an opportunity for another bearish wave. Accordingly, we expect downside attempts to resume today .
The trading range for today is expected among key support at 1.5840 and key resistance at 1.6100.
The general trend over short term basis is to the downside targeting 1.4225 as far as areas of 1.6875 remain intact. 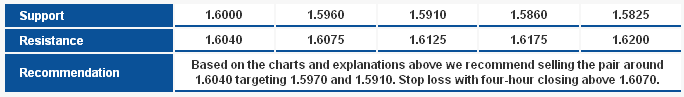 GBP/USD_S&R" title="GBP/USD_S&R" width="684" height="97">
USD/JPY USD/JPY" title="USD/JPY" width="637" height="462">
Indeed, the pair dipped towards the key support area around 79.50 and the 200-days SMA. Actually, it has penetrated it to print an intraday low yesterday at 79.31. However, the pair rebounded slightly with the start of today’s session, in general, we have been waiting for this retest of 79.50 level which activated our previously suggested bullish scenario . Holding above 79.10-79.00 is necessary for the scenario to remain valid.
The trading range for today is expected among key support at 79.00 and key resistance now at 80.50.
The general trend over short term basis is to the upside targeting 87.45 as far as areas of 75.20 remain intact. 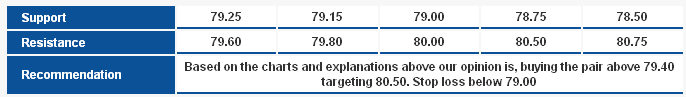 USD/JPY_S&R" title="USD/JPY_S&R" width="686" height="97">
USD/CHF USD/CHF" title="USD/CHF" width="637" height="462">
The pair is approaching 0.9400 where it will complete the bearish Butterfly Pattern. The pair did not reach this level for the pattern to be ideal, yet we can still consider the pattern on the chart as a bearish harmonic Butterfly Pattern which remains valid with trading below 0.9490. Therefore, we expect the pair to start a new downside wave which might carry the pair toward 38.2% correction for the pattern and the first target at 0.9405 and if cleared move toward the second target at 0.9355. Momentum indicators are biased negatively and the Linear Regression Indicator 34 is trading negatively.
The trading range for today is among key support at 0.9325 and key resistance at 0.9570.
The general trend over short term basis is to the downside targeting 0.8860 as far as areas of 0.9775 remains intact. 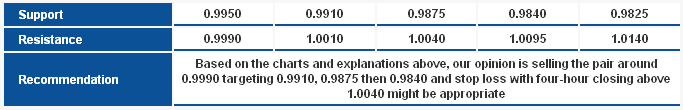 USD/CAD_S&R" title="USD/CAD_S&R" width="683" height="110">
USD/CAD USD/CAD" title="USD/CAD" width="637" height="462">
The pair couldn’t resume the upside move and the upside movement over the past two days remained limited below the PRZ for the bearish Butterfly Pattern. We expect the pair to attempt moving lower again to retest the first target of the pattern at 0.9905 which if breached will extend the bearishness toward the second target at 0.9840. Trading below 1.0040 keeps the bearishness intact over intraday basis and over the coming period.
The trading range for today is among the key support at 0.9825 and key resistance at 1.0140.
The short term trend is expected to the downside with daily closing below 1.0125 targeting areas of 0.9400.  USD/CAD_S&R" title="USD/CAD_S&R" width="683" height="110">
AUD/USD AUD/USD" title="AUD/USD" width="637" height="462">
The pair settled for areas around 1.0385 in the bearish move yesterday and shows a possible minor ascending channel within the higher-scale ascending channel as provided on the chart. Stochastic offered a positive crossover and RSI rebounded to the upside from 50 areas. Therefore, we expect the pair to turn higher again and the upside move today requires stability above 1.0385 and above 1.0330 over the coming days.
The trading range for today is expected among the key support at 1.0260 and resistance at 1.0560.
The short term trend is to the downside targeting 0.9400 with steady daily closing below 1.0710. 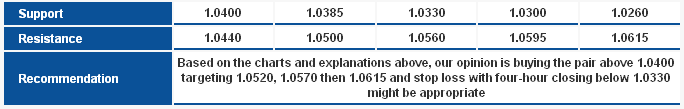 AUD/USD_S&R" title="AUD/USD_S&R" width="684" height="109">
NZD/USD NZD/USD" title="NZD/USD" width="637" height="462">
We will wait today for the possible formation of a sideways trading range after the pair attempted to exit the upside wave. Stability below 0.8185 is considered negative, but the last time the pair breached this level and set the low near 0.8100 support it rebounded higher again above the main ascending support and therefore, trading above 0.8100 prevents us from suggesting the extension of the downside move. At the same time, we cannot favor the bullishness since trading is below the mains ascending support and below the Linear Regression Indicators and accordingly we will stay neutral today as well.
The trading range for today is expected among the key support at 0.8000 and resistance at 0.8255.
The short term trend is to the upside targeting 0.8400 with steady daily closing above 0.7930. 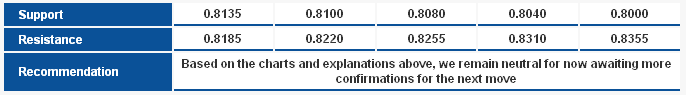 NZD/USD_S&R" title="NZD/USD_S&R" width="686" height="95">