
EUR/USD EUR/USD" title="EUR/USD" width="600" height="600">
The pair rose yesterday stabilizing above 1.3360 levels failing the suggested bearish correction expectations. Meanwhile, the pair is trading below the last top completed at 1.3406 levels preventing us today from favoring a bias; therefore we remain neutral to see trading around 1.3406. Failing to breach 1.3406 levels might revive the downside correction, while breaching it might push the pair toward 1.3480 levels.
The trading range for today is among the key support at 1.3235 and key resistance at 1.3505.
The general trend over short term basis is negative, targeting 1.1865 as far as areas of 1.3550 remains intact. 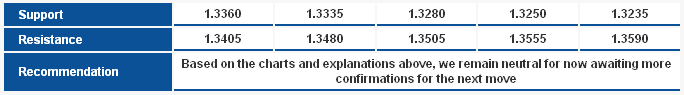 EUR/USD_S&R" title="EUR/USD_S&R" width="684" height="95">
GBP/USD GBP/USD" title="GBP/USD" width="600" height="600">
The pair remained stable below the ascending key support as shown on the graph, and Linear Regression Indicators are negative. Stochastic is not showing any positivity till now despite entering oversold areas, therefore we hold on to our negative expectations pointing out that trading below 1.6020 levels will keep the downside move valid.
The trading range for today is among key support at 1.5790 and key resistance at 1.6125.
The general trend over short term basis is to the downside targeting 1.6875 as far as areas of 1.4225 remains intact. 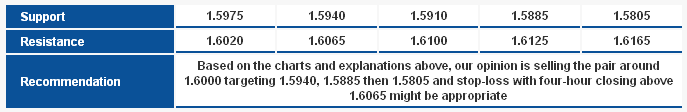 GBP/USD_S&R" title="GBP/USD_S&R" width="687" height="112">
USD/JPY USD/JPY" title="USD/JPY" width="600" height="600">
The pair failed the bearish correction expectations, but the pair responded to our opposite expectations that breaching 89.00 levels will trigger an upside move and now the pair is trading to the upside and touched the psychological barrier at 90.00. Positivity shown on Linear Regression Indicators and trading within an ascending channel keeps trading above 88.20 levels positive, while stability above 89.55 levels extends the bullishness.
The trading range for today is among key support at 88.20 and key resistance at 92.05.
The general trend over short term basis is to the upside targeting 91.70 as far as areas of 83.40 remain intact. 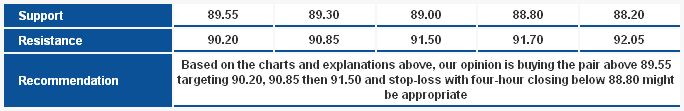 USD/JPY_S&R" title="USD/JPY_S&R" width="684" height="111">
USD/CHF USD/CHF" title="USD/CHF" width="600" height="600">
The pair is trading positively responding to our harmonic expectations, and is trading now around top C (in pink) of the bullish harmonic AB=CD Pattern which might form another harmonic formation. Stability above 0.9320 levels is considered positive and trading above it might extend the upside move reaching levels 0.9425 and 0.9465. A break of 0.9265 level worries us over intraday basis and might delay our expectations for today.
The trading range for today is among key support at 0.9235 and key resistance at 0.9465.
The general trend over short term basis is to the downside stable at levels 0.9775 targeting 0.8860. 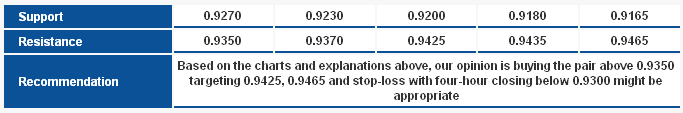 USD/CHF_S&R" title="USD/CHF_S&R" width="683" height="113">
USD/CAD USD/CAD" title="USD/CAD" width="600" height="600">
The pair is trading with high volatility above 0.9820 levels and stabilized above 88.6% at 0.9840 levels. Therefore, the possibility of extending the bullish attempts is valid today as Linear Regression Indicators and Stochastic are showing clear positive signals.
The trading range for today is between the key support at 0.9735 and the key resistance at 1.000.
The general trend over short term basis is to the downside below levels 1.0125 targeting 0.9400. 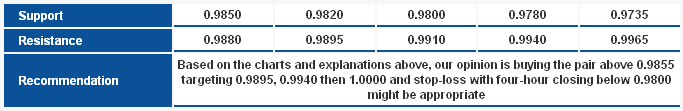 USD/CAD_S&R" title="USD/CAD_S&R" width="683" height="111">
AUD/USD AUD/USD" title="AUD/USD" width="600" height="600">
Areas of 1.0495 managed to halt the downside move in the past two days, and we find the pair trading above Linear Regression Indicators today which is positive. The pair should stabilize again above 1.0535 levels after it failed yesterday to confirm the bullishness, and accordingly we will stay aside for now awaiting for confirmation.
The trading range for today is among key support at 1.0435 and key resistance at 1.0650.
The general trend over short term basis is to the downside below levels 1.0710 targeting 0.9400. 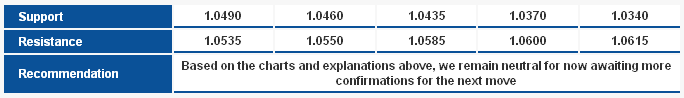 AUD/USD_S&R" title="AUD/USD_S&R" width="684" height="98">
NZD/USD NZD/USD" title="NZD/USD" width="600" height="600">
Yesterday’s closing was above 0.8355 levels despite the downside move, but at the same time stability below Linear Regression Indicator 34 worries us in regards of the positive expectations. Therefore, we prefer to remain neutral for today.
The trading range for today might be among key support at 0.8230 and key resistance at 0.8480.
The general trend over short term basis is to the upside with steady daily closing above 0.8130 targeting 0.8845. 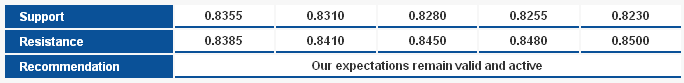 NZD/USD_S&R" title="NZD/USD_S&R" width="684" height="83">
Technical Crosses
GBP/JPY GBP/JPY" title="GBP/JPY" width="600" height="600">
Positivity has returned as the pair rose above 142.60 , especially when it also settles above Linear Regression Indicators. Stochastic signals overbought indications and this threatens the continuation of the uptrend. Nonetheless, unless we witness a break to 142.60, we shall overlook these indications and focus on the pair`s stability above LRIs as mentioned above.
The trading range expected for today is between the key support at 141.10 and the key resistance at 145.60.
The short-term trend is to the downside targeting 112.00 as far as 150.00 remains intact. 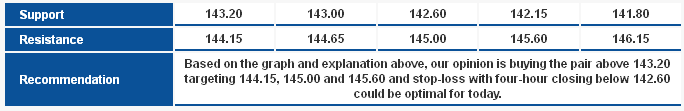 GBP/JPY_S&R" title="GBP/JPY_S&R" width="684" height="111">
EUR/JPY EUR/JPY" title="EUR/JPY" width="600" height="600">
Simply by looking at Linear Regression Indicators 34 and 55 movements, we can deduce that uptrend is continuing , especially following the pair`s failure to consolidate below 116.15 via downside correction at this week`s kickoff. This shows that the pair`s capability to reach 122.15 is now significantly valid just by settling above 119.90. Stochastic, although showing overbought signals, is moving bullishly to support continued positivity.
The trading range for today is between the key support at 119.25 and the key resistance at 122.40.
The short-term trend is to the upside targeting 109.15 as far as 98.75 remains intact at week`s closing. 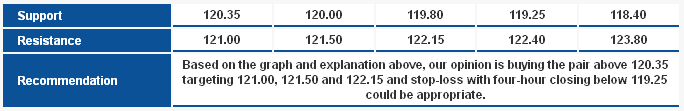 EUR/JPY_S&R" title="EUR/JPY_S&R" width="684" height="111">
EUR/GBP EUR/JPY" title="EUR/JPY" width="600" height="600">
The pair`s breach to 0.8330 placed it in a fresh upside wave thwarting a potential downside correction. Looking at the weekly graph, we find the pair has accomplsihed a weekly closing - last week - above 28.2% correction at 0.8260. With that, we shall consider trading above this correction a push toward more gains to test 50% and 61.8% corrections at 0.8420 and 0.8575, respectively. Linear Regression Indicators support positivity while also the pair`s stability above Exponential Moving Average (EMA) 50 boosts the positivity.
The trading range expected for today is between the key support at 0.8260 and the key resistance 0.8500.
The short-term trend is to the upside targeting 1.0370 as far as 0.7785 remains intact. 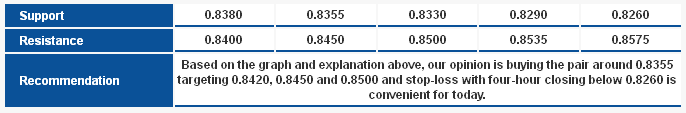 EUR/GBP_S&R" title="EUR/GBP_S&R" width="686" height="113">
- English (UK)
- English (India)
- English (Canada)
- English (Australia)
- English (South Africa)
- English (Philippines)
- English (Nigeria)
- Deutsch
- Español (España)
- Español (México)
- Français
- Italiano
- Nederlands
- Português (Portugal)
- Polski
- Português (Brasil)
- Русский
- Türkçe
- العربية
- Ελληνικά
- Svenska
- Suomi
- עברית
- 日本語
- 한국어
- 简体中文
- 繁體中文
- Bahasa Indonesia
- Bahasa Melayu
- ไทย
- Tiếng Việt
- हिंदी
Major Currencies Report: EUR/USD Rises, GBP/USD Remains Stable
Published 01/18/2013, 04:37 AM
Updated 07/09/2023, 06:31 AM
Major Currencies Report: EUR/USD Rises, GBP/USD Remains Stable
Technical Major Currencies
Latest comments
Loading next article…
Install Our App
Risk Disclosure: Trading in financial instruments and/or cryptocurrencies involves high risks including the risk of losing some, or all, of your investment amount, and may not be suitable for all investors. Prices of cryptocurrencies are extremely volatile and may be affected by external factors such as financial, regulatory or political events. Trading on margin increases the financial risks.
Before deciding to trade in financial instrument or cryptocurrencies you should be fully informed of the risks and costs associated with trading the financial markets, carefully consider your investment objectives, level of experience, and risk appetite, and seek professional advice where needed.
Fusion Media would like to remind you that the data contained in this website is not necessarily real-time nor accurate. The data and prices on the website are not necessarily provided by any market or exchange, but may be provided by market makers, and so prices may not be accurate and may differ from the actual price at any given market, meaning prices are indicative and not appropriate for trading purposes. Fusion Media and any provider of the data contained in this website will not accept liability for any loss or damage as a result of your trading, or your reliance on the information contained within this website.
It is prohibited to use, store, reproduce, display, modify, transmit or distribute the data contained in this website without the explicit prior written permission of Fusion Media and/or the data provider. All intellectual property rights are reserved by the providers and/or the exchange providing the data contained in this website.
Fusion Media may be compensated by the advertisers that appear on the website, based on your interaction with the advertisements or advertisers.
© 2007-2024 - Fusion Media Limited. All Rights Reserved.