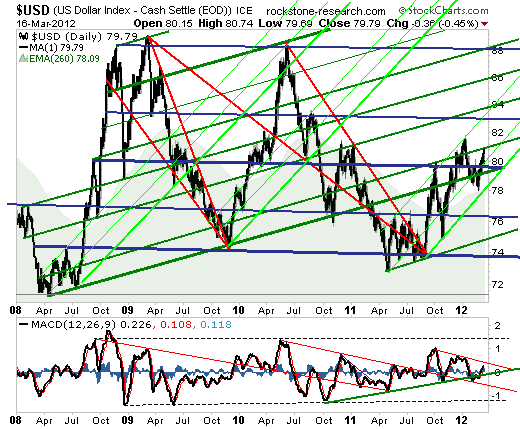
The USD index has been trending upwards within the dark-green trend-channel since 2008, whereas major buy-signals were generated at the apex of the red triangles as thereafter the so-called „thrusts“ started. However, the goal of a thrust is to rise above the high of the triangle and transform this resistance into a new support – in order for a new upward-trend to commence thereafter.
The first thrust started in late 2009 and went from approx. 74 to 88 points. The second thrust started in September 2011 also at 74 points and has recently managed to break above the important blue trendline at approx. 79.5 points.
On Friday, the USD rose as high as 80.74 points touching the green resistance and thus generating a short-term sell-signal. However, the USD closed at 79.79 points holding on the blue support generating a short-term buy-signal. Hence, a more definite buy-signal is issued once breaking and holding above the green resistance currently at approx. 81 points, whereas a more definite sell-signal is given once breaching the blue and green support at approx. 79 points. A major sell-signal is generated once breaching the light-green support and as well the 260-day EMA both currently running at approx. 78 points.
As per the MACD, a major buy-signal is generated once rising above the red resistance, whereas a major sell-signal is given when breaching the green support.

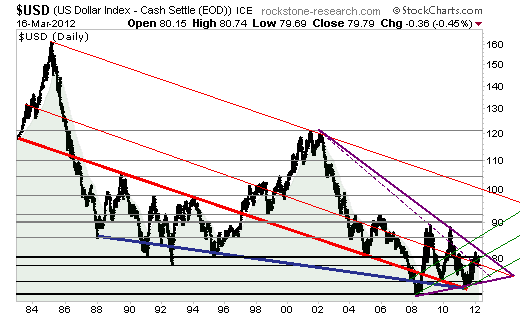
Taking the USD index since 1983 into perspective, it strikes the eye that the greenback fluctuated within the boundaries of the red-blue triangle between 1987-1997 until rising above the red (resistive) triangle leg approx. 92 points. This so-called „breakout“ went from approx. 92 to 122 points in 2002, whereafter so-called „pullbacks“ to the (formerly resistive) red leg and ultimately to the apex of the red-blue triangle occurred.
The final movement of a triangular price formation („thrust“) typically occurrs near or after having reached the apex and is either a strong and longer-termed up- or downward-trend. We anticipate a strong and longer-termed thrust to the upside when rising above the upper violet triangle leg currently at approx. 82 points, whereas a thrust to the downside is expected when breaching the lower violet triangle leg respectively the level of the red-blue triangle-apex at approx. 72 points.

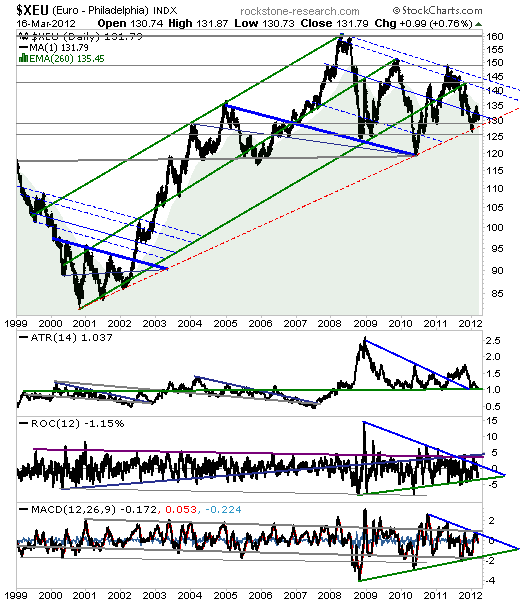
The Euro index fluctuated beneath the blue triangle leg until mid-2002 when starting to thrust to the upside (a pullback is not mandatory for a thrust to start) from approx. 92 to 135 points in 2005, whereafter the price consolidated beneath the blue triangle leg. In 2007, a breakout started from 135 to 160 points until 2008, whereafter 2 pullbacks occurred having reached the apex of the blue-grey triangle at approx. 120 points in late 2010. Since then, the thrust to the upside has started, whereas it becomes more definite when rising above the uppermost blue-dotted resistance currently at approx. 145 points. A short-term sell-signal is generated when breaching the red-dotted and grey supports at 130 and 125 points, whereas a major sell-signal à la thrust to the downside is not given until breaching the level of the blue-grey trianle apex at 120 points. The ATR indicator moved within the blue-green triangle between 2008-2011, whereas a breakout and pullback occurred thereafter. Thus, the thrust can start any time now (sell-signal à la thrust to the downside when breaching the green support). The ROC and MACD indicators still fluctuate within their respective triangles.

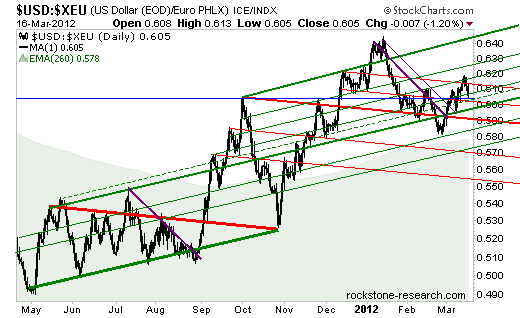
Taking a closer look at the USD/EUR index ratio, it becomes clear that a breakout and pullback from the red-green triangle was completed in November 2011, whereafter the thrust to the upside commenced. Generally, the goal of a thrust is to transform the high of the triangle or breakout (blue horizontal trendline respectively approx. 0.60 points) into a new support – in order for a new and longer-termed upward-trend to start. As the first pullback did not hold above this level, a second pullback was made. Thus, a major sell-signal is not given until breaching the 0.60-level again.

The first thrust started in late 2009 and went from approx. 74 to 88 points. The second thrust started in September 2011 also at 74 points and has recently managed to break above the important blue trendline at approx. 79.5 points.
On Friday, the USD rose as high as 80.74 points touching the green resistance and thus generating a short-term sell-signal. However, the USD closed at 79.79 points holding on the blue support generating a short-term buy-signal. Hence, a more definite buy-signal is issued once breaking and holding above the green resistance currently at approx. 81 points, whereas a more definite sell-signal is given once breaching the blue and green support at approx. 79 points. A major sell-signal is generated once breaching the light-green support and as well the 260-day EMA both currently running at approx. 78 points.
As per the MACD, a major buy-signal is generated once rising above the red resistance, whereas a major sell-signal is given when breaching the green support.

Taking the USD index since 1983 into perspective, it strikes the eye that the greenback fluctuated within the boundaries of the red-blue triangle between 1987-1997 until rising above the red (resistive) triangle leg approx. 92 points. This so-called „breakout“ went from approx. 92 to 122 points in 2002, whereafter so-called „pullbacks“ to the (formerly resistive) red leg and ultimately to the apex of the red-blue triangle occurred.
The final movement of a triangular price formation („thrust“) typically occurrs near or after having reached the apex and is either a strong and longer-termed up- or downward-trend. We anticipate a strong and longer-termed thrust to the upside when rising above the upper violet triangle leg currently at approx. 82 points, whereas a thrust to the downside is expected when breaching the lower violet triangle leg respectively the level of the red-blue triangle-apex at approx. 72 points.

The Euro index fluctuated beneath the blue triangle leg until mid-2002 when starting to thrust to the upside (a pullback is not mandatory for a thrust to start) from approx. 92 to 135 points in 2005, whereafter the price consolidated beneath the blue triangle leg. In 2007, a breakout started from 135 to 160 points until 2008, whereafter 2 pullbacks occurred having reached the apex of the blue-grey triangle at approx. 120 points in late 2010. Since then, the thrust to the upside has started, whereas it becomes more definite when rising above the uppermost blue-dotted resistance currently at approx. 145 points. A short-term sell-signal is generated when breaching the red-dotted and grey supports at 130 and 125 points, whereas a major sell-signal à la thrust to the downside is not given until breaching the level of the blue-grey trianle apex at 120 points. The ATR indicator moved within the blue-green triangle between 2008-2011, whereas a breakout and pullback occurred thereafter. Thus, the thrust can start any time now (sell-signal à la thrust to the downside when breaching the green support). The ROC and MACD indicators still fluctuate within their respective triangles.

Taking a closer look at the USD/EUR index ratio, it becomes clear that a breakout and pullback from the red-green triangle was completed in November 2011, whereafter the thrust to the upside commenced. Generally, the goal of a thrust is to transform the high of the triangle or breakout (blue horizontal trendline respectively approx. 0.60 points) into a new support – in order for a new and longer-termed upward-trend to start. As the first pullback did not hold above this level, a second pullback was made. Thus, a major sell-signal is not given until breaching the 0.60-level again.

