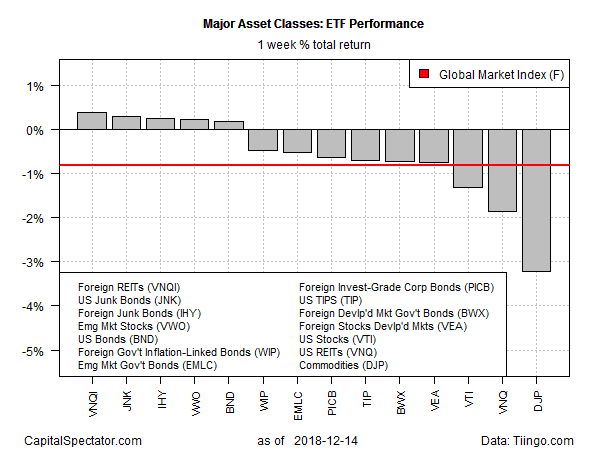
The headlines focused on the sharp losses in US and European stocks last week, but performances across the major asset classes delivered a mixed picture, based on a set of exchange traded products.
On the downside, US stocks and real estate investment trusts (REITs), along with broadly defined commodities, posted hefty declines. Meanwhile, foreign real estate and junk bonds in the US and foreign markets led the gainers, albeit with comparatively modest increases.
The biggest rise for the major asset classes during the trading week through Dec. 14: Vanguard Global ex-US Real Estate (NASDAQ:VNQI), which edged up 0.4%.
On the downside, broadly defined commodities fell sharply last week, suffering the steepest setback for the major asset classes. The iPath Bloomberg Commodity (NYSE:DJP) tumbled 3.2%, leaving the exchange-traded note near its lowest level this year.
Last week’s trading continued to weigh on an ETF-based version of the Global Markets Index (GMI.F). This investable, unmanaged benchmark that holds all the major asset classes in market-value weights fell 0.8% — the fourth weekly loss in the past five weeks for GMI.F.

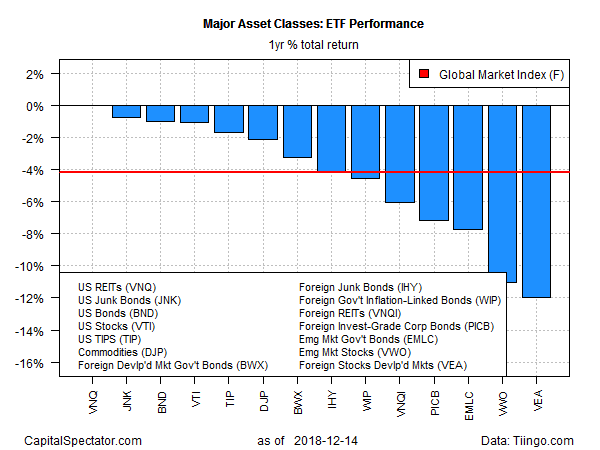
For the one-year profile, losses now dominate across the spectrum, save for a fractional gain in US REITs. Vanguard Real Estate (NYSE:VNQ) is up a thin five basis points (effectively a zero return) for the trailing one-year window.
Otherwise, the rest of the major asset classes are in the red for the one-year change. The biggest setback at the moment is in foreign stocks in developed markets. Vanguard Developed Markets (NYSE:VEA) has lost nearly 12% over the past year (based on 252 trading days).
GMI.F’s one-year return is a middling 4.2% loss vs. the rest of the field.

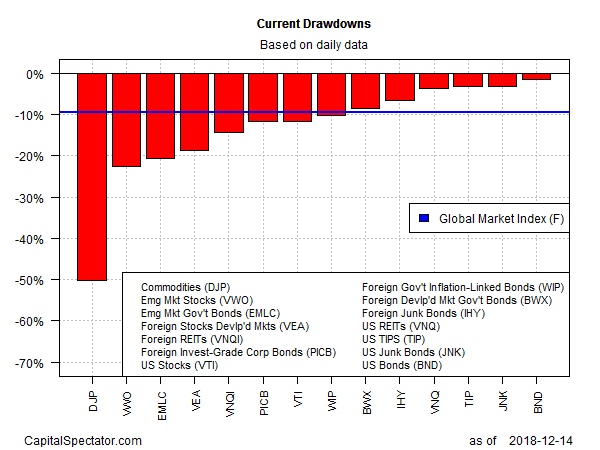
Ranking the major asset classes based on drawdown reveals that broadly defined commodities continue to post the steepest peak-to-trough slide: DJP closed last week with a drawdown of roughly -50%.
The softest drawdown at the moment is found in investment-grade US bonds. Vanguard Total Bond Market (NYSE:BND) ended last week at a price that was just 1.5% below its previous peak.
GMI.F’s current drawdown is considerably steeper at -9.5%.

