Selloff or Market Correction? Either Way, Here's What to Do NextSee Overvalued Stocks

Major Asset Classes Performance Review, January 2019

Published 02/01/2019, 07:06 AM
Updated 07/09/2023, 06:31 AM
NQGM
-
RUATU
-
RMZ
-

January delivered a strong rebound in the global markets, lifting all the major asset classes amid a powerful renewal of risk-on sentiment. The strong start to 2019 contrasts with December’s rout that inflicted deep losses far and wide.

The new year, by contrast, is off to a bullish start that’s unusually potent and far-flung. It’s unclear if the resurgence in animal spirits has legs for the rest of the year. Or is the latest bounce merely a temporary snap-back to 2018’s year-end slump? In any case, for the first time in a year-and-a-half, all the major asset classes posted monthly gains.

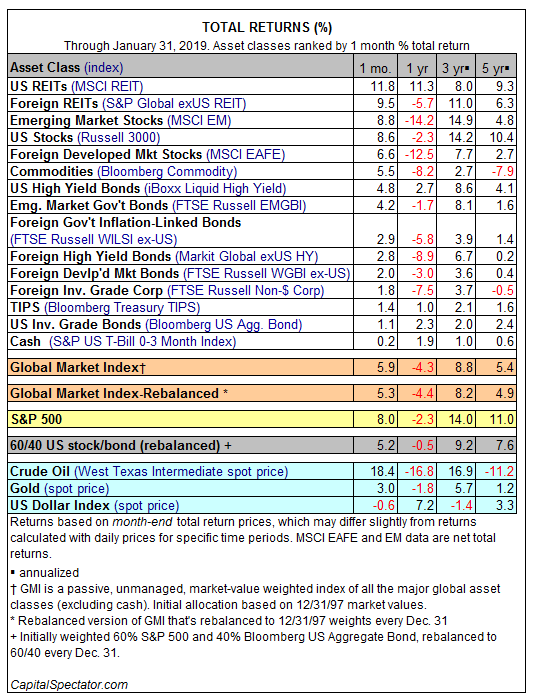
U.S. real estate investment trusts (REITs) earned the biggest return in January: MSCI US REIT Index surged 11.8%, the benchmark’s strongest monthly increase in more than seven years.

Although all the major classes bounced back last month, there was a wide range of results. The softest gain was in cash: S&P U.S. T-Bill 0-3 Month Index edged up 0.2% in January.
Total Returns

The muscular tailwind blowing across global markets generated a strong gain for the NASDAQ Global Markets Index (GMI), an unmanaged benchmark that holds all the major asset classes in market-value weights. The benchmark rose by a strong 5.9% in January, the best monthly gain for GMI since 2011.

U.S. stocks jumped 8.6% in the first month of 2019, based on theRussell 3000 Index, which nearly reversed December’s hefty 9.3% loss. Meantime, investment-grade U.S. bonds continued to trend higher in January. For the third straight month, the Bloomberg Aggregate Bond Index posted a gain, rising 1.1% (albeit the weakest advance last month other than cash among the major asset classes).

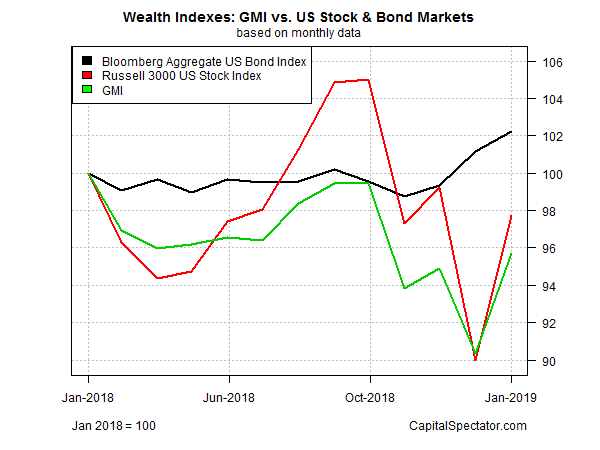
Despite last month’s powerful revival in risk assets, the trailing one-year changes tell a different story, at least from the perspective of January’s end-of-month view. Compared with the U.S. stock market and GMI – each suffering red ink for the annual comparisons — the Bloomberg Aggregate Bond Index (black line in chart) earned a modest 2.3% over the trailing 12-month window.

Wealth Indexes GMI Vs US Stock & Bond Markets

Latest comments

Loading next article…
Risk Disclosure: Trading in financial instruments and/or cryptocurrencies involves high risks including the risk of losing some, or all, of your investment amount, and may not be suitable for all investors. Prices of cryptocurrencies are extremely volatile and may be affected by external factors such as financial, regulatory or political events. Trading on margin increases the financial risks.
Before deciding to trade in financial instrument or cryptocurrencies you should be fully informed of the risks and costs associated with trading the financial markets, carefully consider your investment objectives, level of experience, and risk appetite, and seek professional advice where needed.
Fusion Media would like to remind you that the data contained in this website is not necessarily real-time nor accurate. The data and prices on the website are not necessarily provided by any market or exchange, but may be provided by market makers, and so prices may not be accurate and may differ from the actual price at any given market, meaning prices are indicative and not appropriate for trading purposes. Fusion Media and any provider of the data contained in this website will not accept liability for any loss or damage as a result of your trading, or your reliance on the information contained within this website.
It is prohibited to use, store, reproduce, display, modify, transmit or distribute the data contained in this website without the explicit prior written permission of Fusion Media and/or the data provider. All intellectual property rights are reserved by the providers and/or the exchange providing the data contained in this website.
Fusion Media may be compensated by the advertisers that appear on the website, based on your interaction with the advertisements or advertisers.
© 2007-2024 - Fusion Media Limited. All Rights Reserved.