Topic: BRICs equity markets have been struggling late 2010

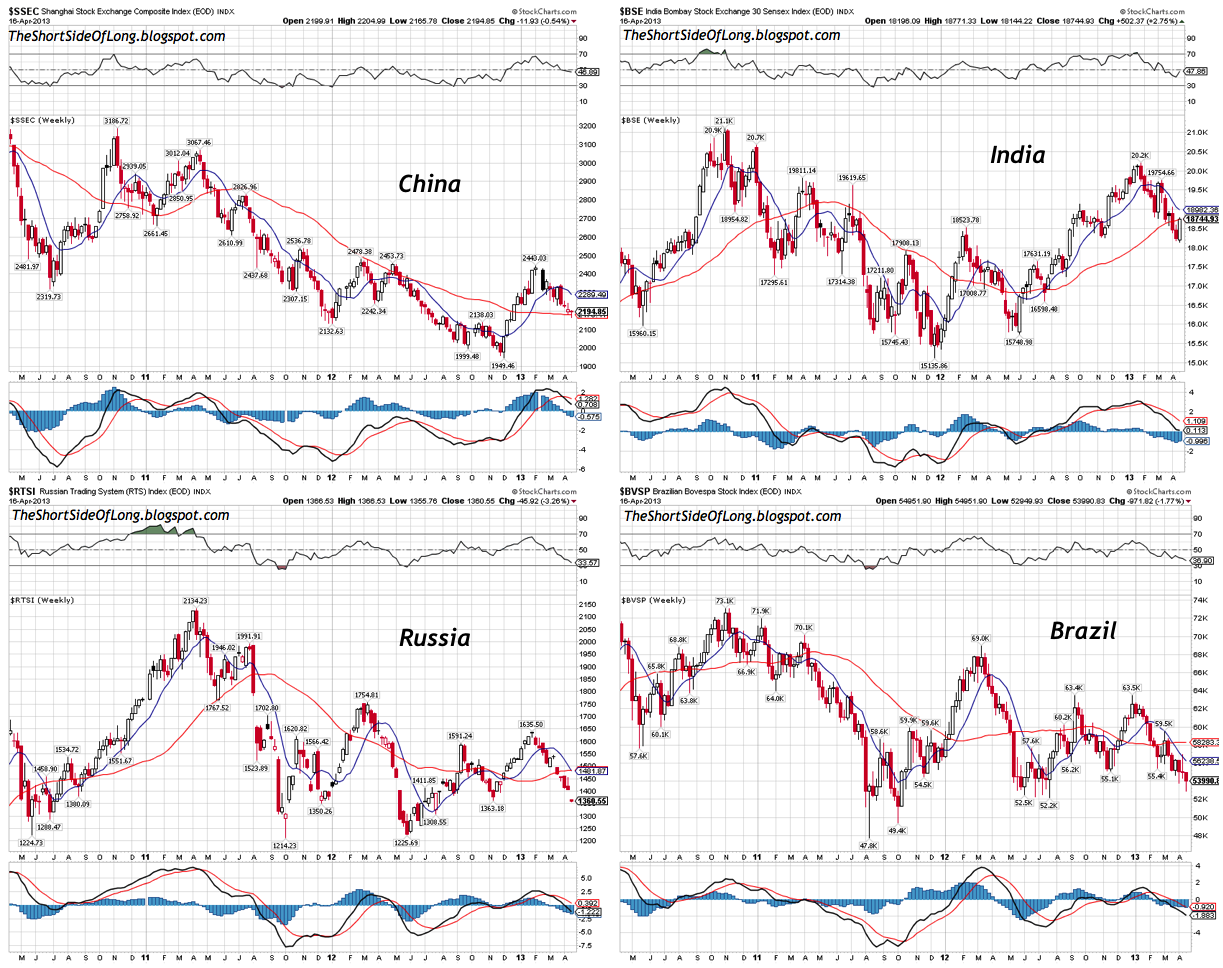
The grid of charts shown above perfectly illustrates the under performance of emerging markets in recent years. Let us quickly cover some of the more important details for the four main BRICs:
Topic: Gold Miners extremely oversold at the level of 8%

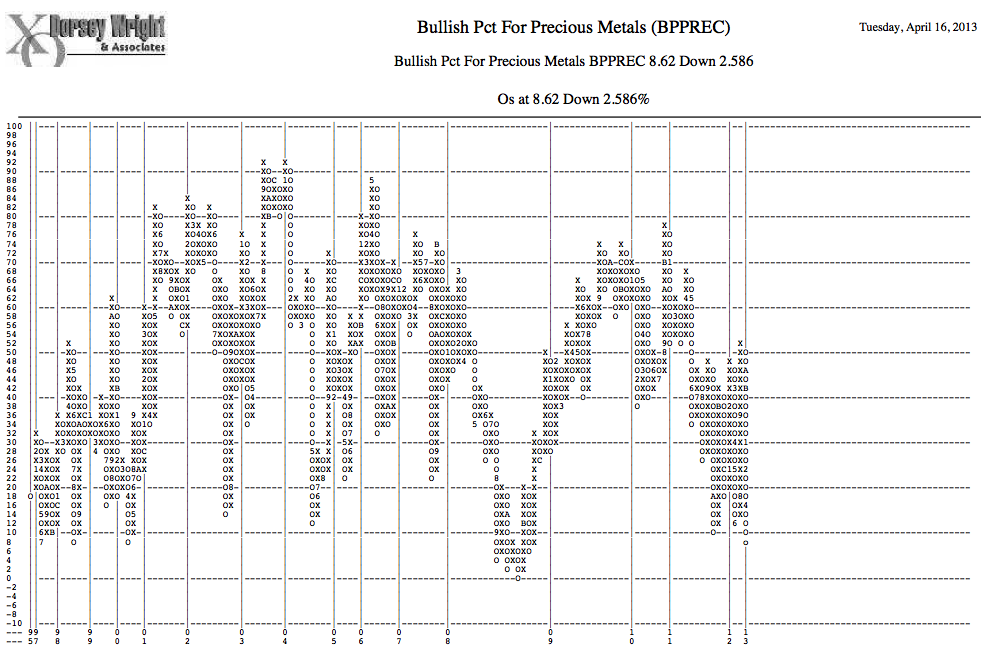
I received an interesting email from a very kind newsletter reader, who shared the above chart with me. We can see that the custom made BPI based on 135 stocks, is currently extremely oversold with a reading of just 8%. Similar oversold levels were seen in 1999 - 2001 period, just as PMs embarked on their secular bull market. However, the chart also shows that we are not as oversold as in October 2008, when the readings fell to 0% (slightly disagreeing with the official HUI BPI).
Topic: Gold price is at most oversold reading... ever!

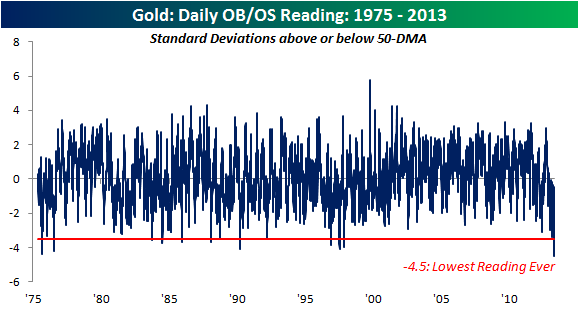
From the near term perspective, there is always a possibility that selling pressure will continue, so that the reading in the chart above can fall even further to 0%, it is fair to say that we have already seen a selling climax in the Gold Miners. Most important of all evidence is to consider the fact that almost 90% of HUI components made a new low on Monday, only seen during the final stages of October 2008 lows. Furthermore, Gold managed to crash 4.5 standard deviations away from its 50 day moving average - the most oversold ever.

The grid of charts shown above perfectly illustrates the under performance of emerging markets in recent years. Let us quickly cover some of the more important details for the four main BRICs:
- Chinese Shanghai Composite has been in a downtrend since late 2007, despite a powerful bear market rally in early parts of 2009. The index is 63% below its all time highs and 35% below its peak in late 2009. On the other hand, the index is still up 27% from the November 2008 lows. China's official debt to GDP ratio stands at 22% (unofficial might be a lot higher just like in the US & EU), equity market P/E at 9.4 and price to book at 1.44.
- Indian Bombay Sensex recently re-tested the 2008 and 2010 highs around 20,000 - 21000 point range. The index is 10% below its all time highs and about 6% below its recent peak at the begining of the year. Indian equities have experienced a tremendous gain of 125% from the March 2009 lows. India's official debt to GDP ratio stands at 68% (unofficial might be a lot higher just like in the US and EU), equity market P/E at 16.2 and price to book at 1.9.
- Russian Trading System remains in a downtrend since its 2011 highs around 2,123 points. Russia being one of the world's largest commodity exporters, the index holds a close correlation with the CRB as well as Crude Oil prices. The RTSI is 45% below its all time highs in 2008 and about 36% below its last major peak in April 2011 (same time Crude Oil peaked). Russia's official debt to GDP ratio stands at only 11% (unofficial might be a lot higher just like in the US and EU), equity market P/E at 5.2 and price to book at 0.7.
- Brazilian Bovespa is currently re-testing its support level from 2011 and 2012 corrections around 52,000 point range. Similar to the Russian equity story, the index holds a close correlation with the CRB prices, as Brazil exports large amounts of commodities to the world. The Bovespa is 27% below its all time highs in 2008 and about 26% below its recent major peak in 2011 (just like the CRB Index). Brazil's official debt to GDP ratio stands at 65% (unofficial might be a lot higher just like in the US and EU), equity market P/E at 13.2 and price to book at 1.6.
Topic: Gold Miners extremely oversold at the level of 8%

I received an interesting email from a very kind newsletter reader, who shared the above chart with me. We can see that the custom made BPI based on 135 stocks, is currently extremely oversold with a reading of just 8%. Similar oversold levels were seen in 1999 - 2001 period, just as PMs embarked on their secular bull market. However, the chart also shows that we are not as oversold as in October 2008, when the readings fell to 0% (slightly disagreeing with the official HUI BPI).
Topic: Gold price is at most oversold reading... ever!

From the near term perspective, there is always a possibility that selling pressure will continue, so that the reading in the chart above can fall even further to 0%, it is fair to say that we have already seen a selling climax in the Gold Miners. Most important of all evidence is to consider the fact that almost 90% of HUI components made a new low on Monday, only seen during the final stages of October 2008 lows. Furthermore, Gold managed to crash 4.5 standard deviations away from its 50 day moving average - the most oversold ever.
