We shine the spotlight on one of the 'biggest' stories to hit the European newswires since the EU debt-deficit crisis began two-years ago, a story that the financial media has 'failed' to cover ...
... on November 1st, in Nazare Portugal, 70 miles north of Lisbon, an ocean side town know for the giant waves generated by a freakish 1000 foot deep canyon that runs right along the cliffs that mark the shore line ... American surfer Garrett McNamara 'caught' a 90-foot wave, and 'rode' it to 'completion', setting a new world's record for the largest wave ever 'surfed'.
Long time readers know my passion for surfing, at least in my younger days (though I do note that McNamara, born in Massachusetts's, is no teenager, at age 44).
So, what, exactly, does this story have to do with Europe ???
Simple.
Europe is trying to 'ride' a tsunami of debt.
Europe has climbed up on its surfboard, and is attempting to set a world record, for successfully staying ahead of the largest peaking-and-curling wave of sovereign debt ever encountered.
Europe is hoping to emerge from the violently churning white water, at the end of the wave, as did McNamara.
The PROBLEM is ... that the EU debt wave ... is a TSUNAMI.
The wave the EU is attempting to ride, is FAR larger than ... 90-feet.
We note comments on the size and power of the wave, from McNamara ...
... "I just didn't realize how big it was. So I started and I kept going down and down, and the drop seemed like forever, and I thought, wow. I started making the bottom turn, and felt the lip hit me. You can see it in the video. You see me look around twice, and then I get hit by the white water on the shoulder, and it feels like a ton of bricks, and I am thinking, I've gotta make this. I've seen waves rip guy's arms off, and I am thinking this thing could tear my head off."
Indeed, the EU debt-tsunami is threatening to rip Europe's head off.
There is NO surfing a tsunami.
The tsunami is currently curling ... and ... is ready to roll over and come crashing down ... with ALL of Europe now watching as a wall of water rapidly approaches, ready to knock down countries that have NOT been perceived as being at risk ... such as Austria, France, and Belgium, with Spanish markets getting slammed as well, against a background still defined by the fiasco in Italy.
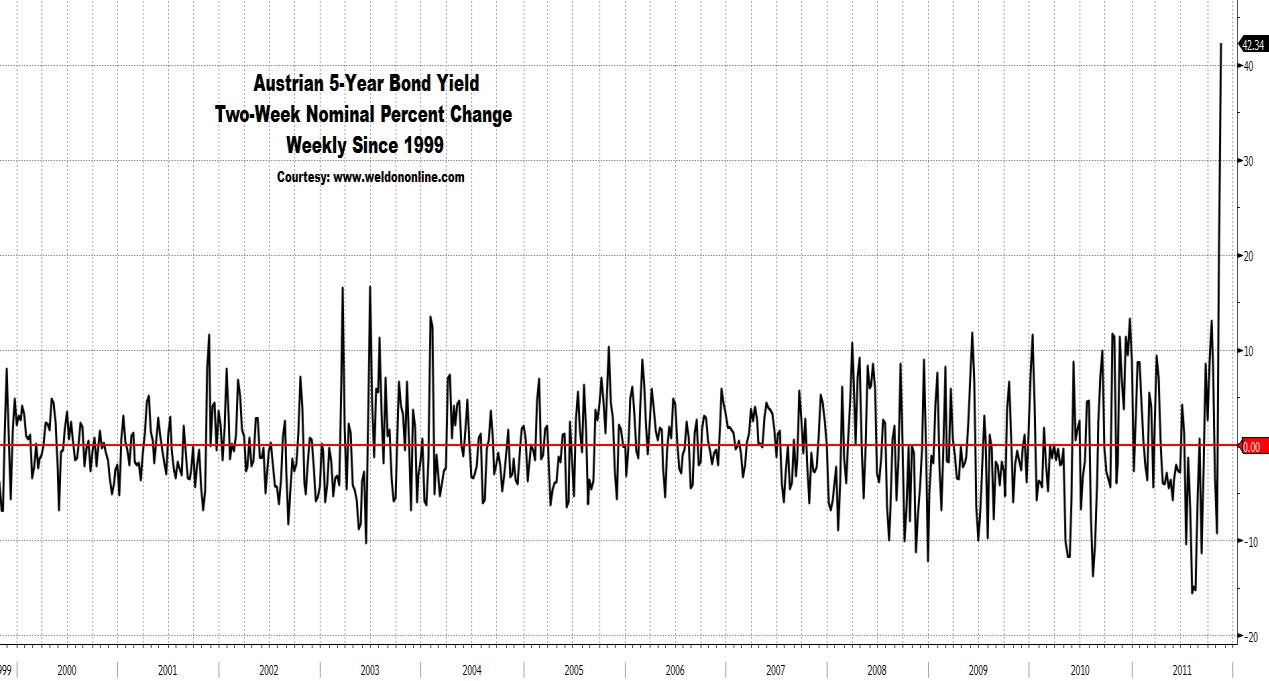
Observe the GIANT WAVE represented within the chart below in which we plot the two-week nominal percentage change in the yield on the Austrian 5-Year Government Bond, which has SOARED by +42.34% in just the last ten trading sessions, EASILY the LARGEST two-week move in Austrian Bonds ...
... EVER !!!!
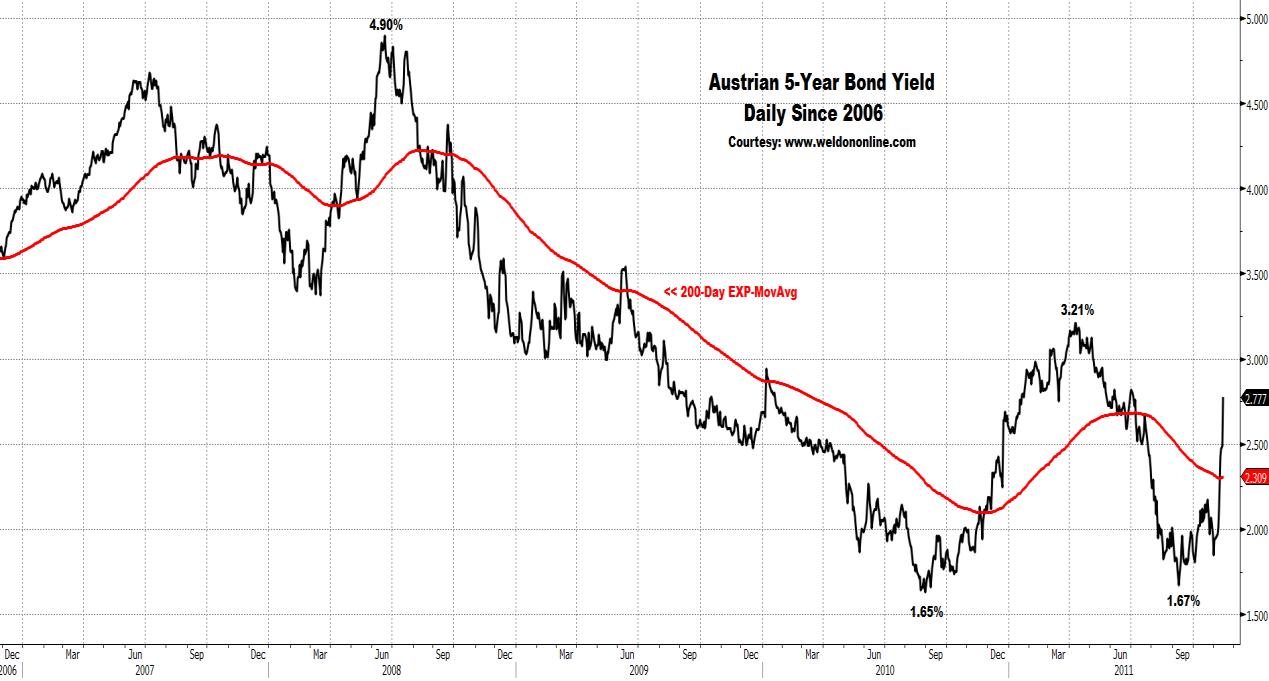
We are closely monitoring the underlying yield in the Austrian 5-Year Bond, shown in the chart on display below. We focus on the double-bottom below 2%, the more recent upside breakout, and the move above the long-term trend defining 200-Day EXP-MA.
A violation of the YTD high of 3.21% constitutes a major upside breakout.
Our trusty data-scalpel in hand, we carve into the debt dynamic to generate a sense for the size of the tsunami.
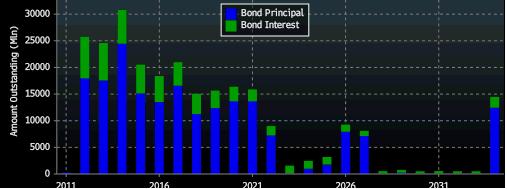
Austrian's sovereign debt outstanding that matures by 2035 (all figures include interest payments due) is 'only' EUR 255.7 billion (or, $346.3 billion), laid out as noted in the chart on display below (courtesy Bloomberg)... with $137.5 billion coming due in the next four years.
No big deal, right ??? A neophyte could surf that wave, right ???
WRONG.
When we 'adjust' the size of Austria's debt, by the population, and compare it to the US population-equivalent debt ...
... we find that Austria's debt is LARGER than the US Treasury's debt, with the US-population adjusted size of Austria's outstanding debt pegged at $13.2 trillion, exceeding the $11.7 trillion in US Treasury debt outstanding.
On a 'population-adjusted-basis', Austria's debt is Europe's THIRD LARGEST.
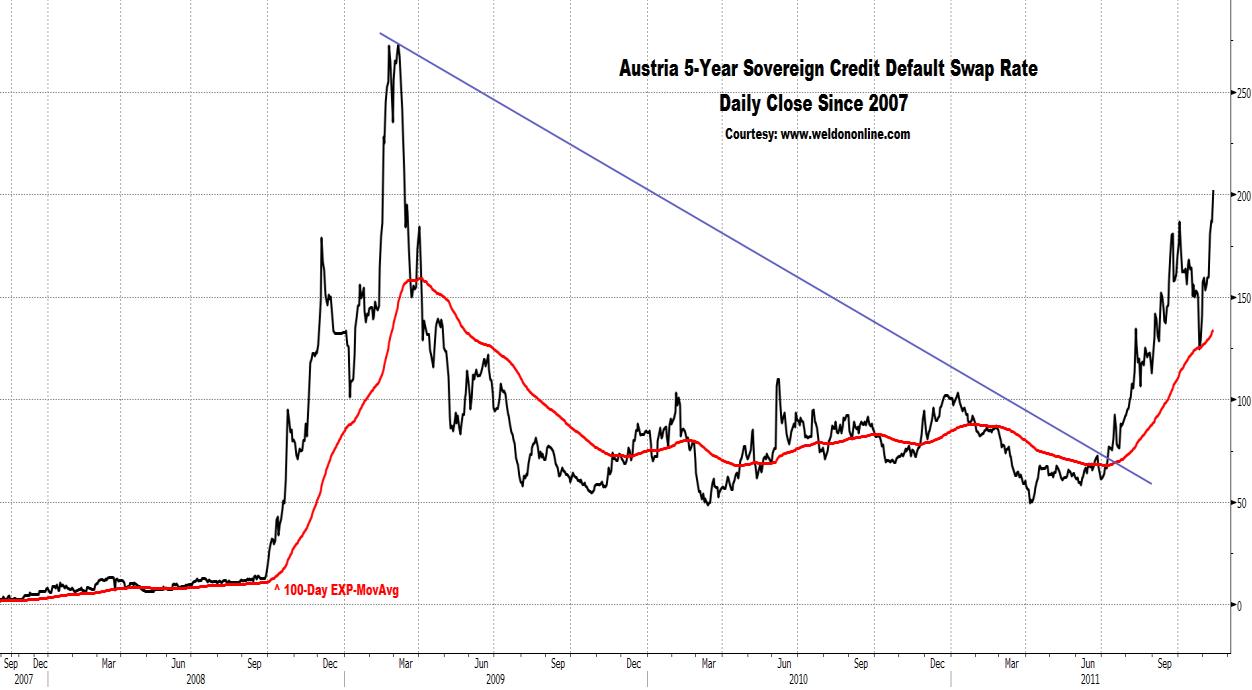
With that in mind, we note the chart below, plotting the 5-Year Sovereign Credit Default Swap Rate linked to Austrian government debt
We ask ... how many Austrian citizens know how to surf ???
We wonder, how many Belgians ... know how to surf ???
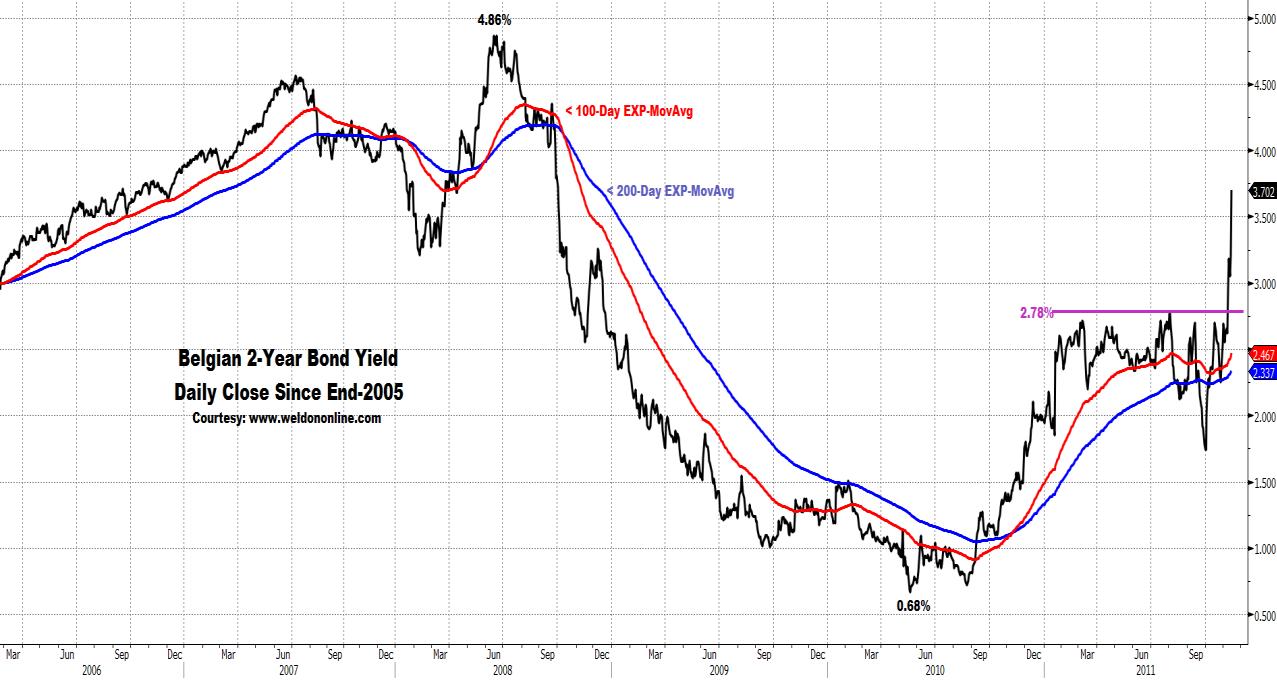
It could be a major problem, if people in these two countries do not know how to surf, given the height of the debt tsunami bearing down on them. We laid out this case in our September 6th Money Monitor, "Mardi ??, c'est done la Belgique", or, "If it's Tuesday, This Must Be Belgium", in which we compared Belgium's sovereign debt to Italy's, with a spotlight on the Belgian 2-Year Bond Yield, then at 2.58%. Today the Belgian 2-Year Bond Yield surged to a new move high of 3.71%, as seen in the chart below, after exploding upwards and violating overhead resistance defined at the previous YTD high of 2.70%.
Since our Money Monitor focus, the Belgian 2-Year Yield has risen by +43.8%.
Applying the same population-equivalent perspective as with Austria, to Belgium, we note the following 'macro-mathematics' ... outstanding sovereign debt (and interest payments) of EUR 419.5 billion, or $ 564.2 billion ... which, adjusted to a US-population 'equivalent' ...
... equals ... $16.99 trillion !!!!
On a 'population-adjusted-basis', Belgium's debt is Europe's LARGEST ... and ... one of the LARGEST in the WORLD.
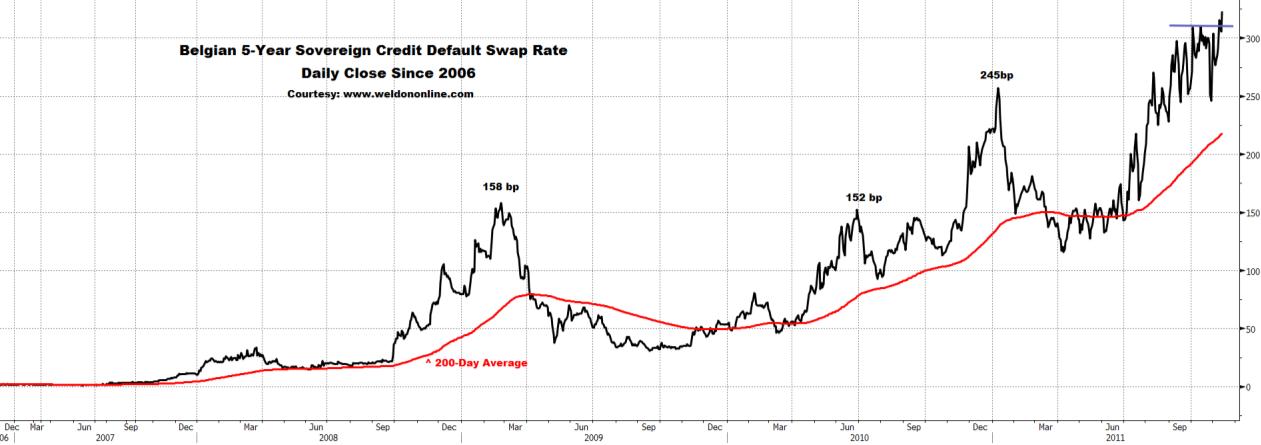
With that in mind, we note the chart below, and the new ALL-TIME HIGHS in the 5-Year Belgian Sovereign Credit Default Swap Rate.
Do the French ... surf ???
"Je crois que non" !!!!
(I don't think so !!!)
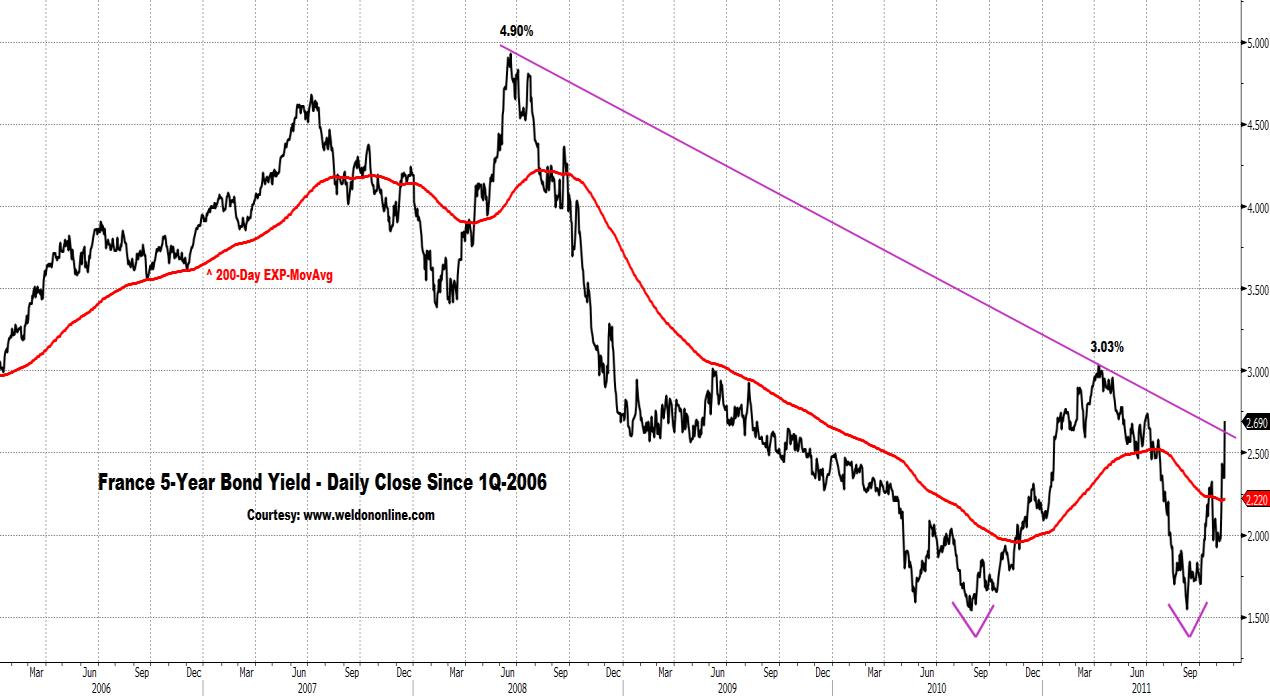
French Bond yields SOARED this morning, with the 5-Year yield reaching 2.69%, rising by an eye-opening +36 basis points today alone ... and ...
... representing an ominously large single-day nominal increase of +15.5%
Technically speaking we focus on the massive double-bottom pattern, along with the upside violation of the long-term trend defining 200-Day EXP-MA, and, today's penetration of the downtrend line in place since the 2008 high.
With EUR 1.7 trillion, or, $2.2865 trillion in debt outstanding ...
... which calculates to a US-population-adjusted equivalent debt of $10.97 trillion ...
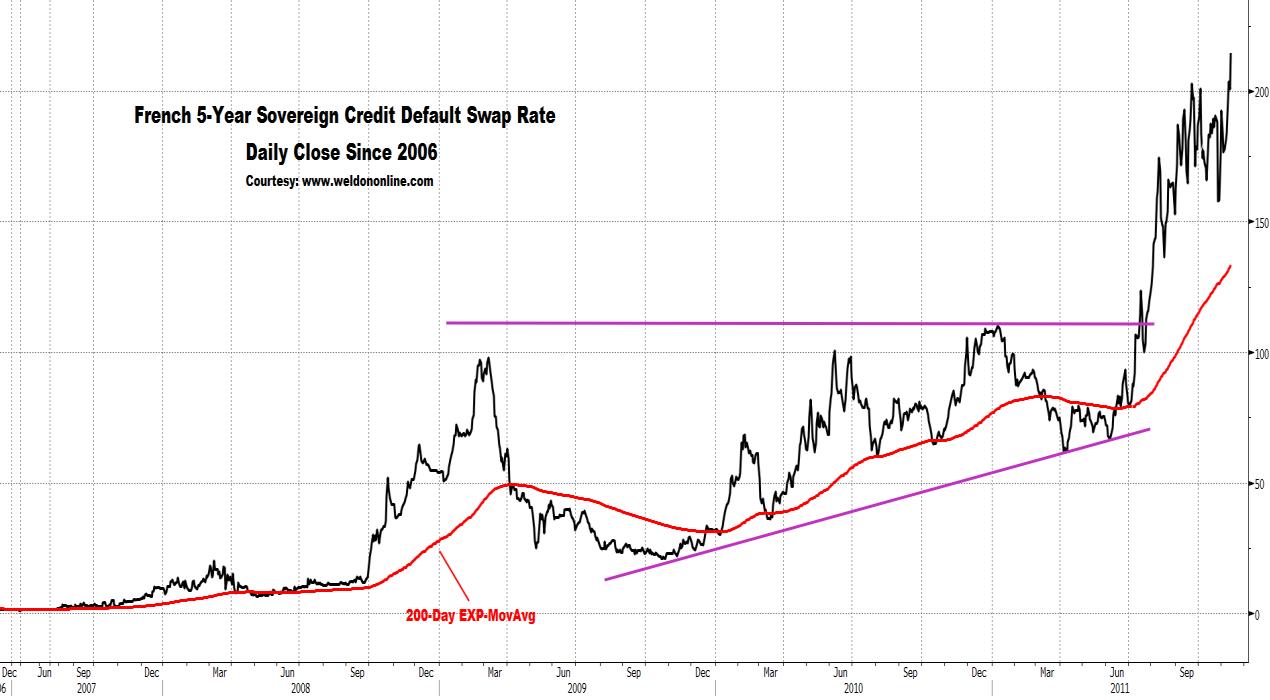
... we note today's push to a NEW ALL-TIME HIGH in the 5-Year Sovereign Credit Default Swap Rate linked to the French government.
Spain has been a media-focus ... but the spotlight should be on Austria, Belgium, and France, with Spain pulling up the rear.
Spain carries debt of EUR 848.3 billion (including interest payments, based on current bond yields) ... or ... $1.141 trillion ...
... 'equal' to $7.633 trillion in US-population adjusted terms, putting it below Belgium, Italy, Austria, France, and Germany.
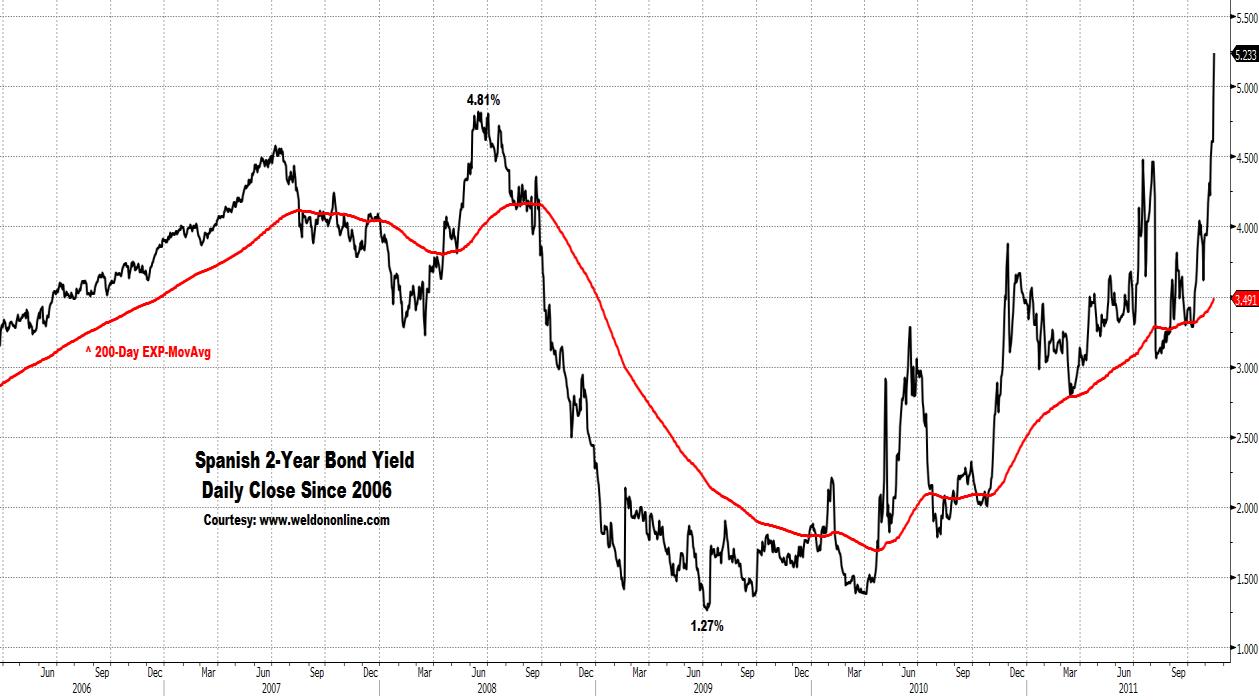
Still, Spanish bond yields are SOARING, and breaking out technically to a significantly greater degree than are yields in other countries (other than Italy and Greece) ... having already violated their mid-2008 highs ...
... as evidenced in the chart on display below.
At the current new multi-year high of 5.23% ... the Spanish 2-Year Bond yield has risen by +311.8% since bottoming in the summer of 2009 at 1.27%.
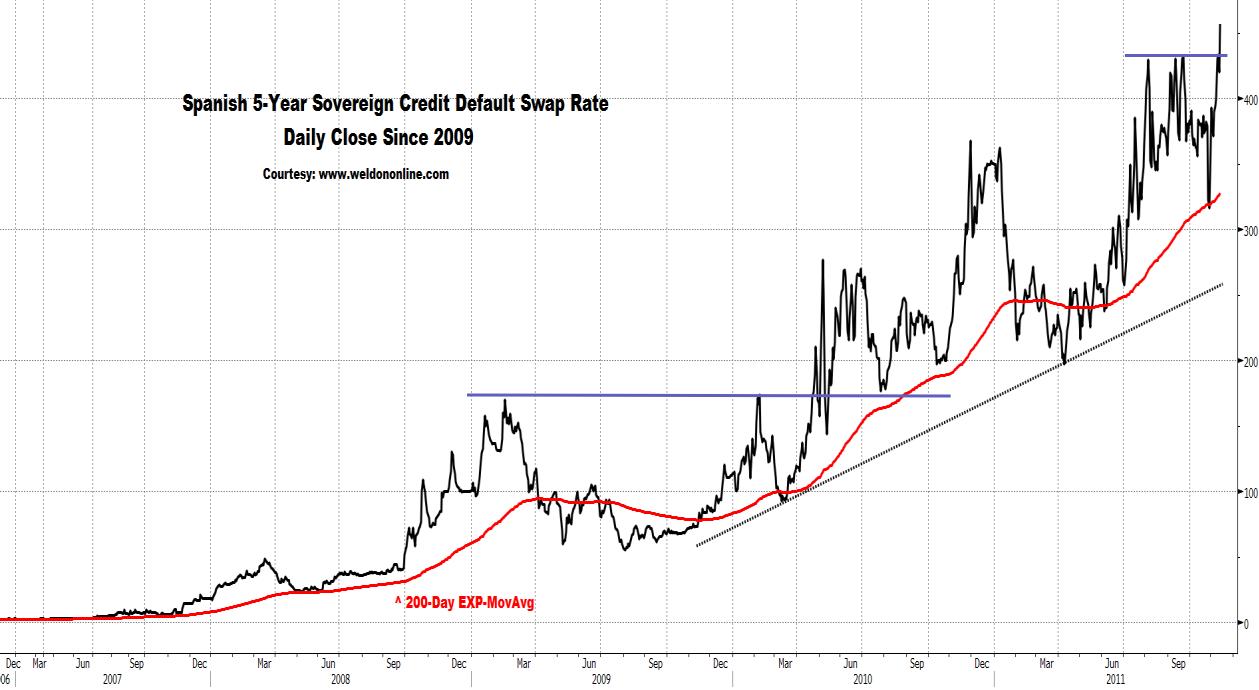
And, as seen in the chart on display below, France is NOT immune to thoughts of a debt default, as defined by today's surge to a NEW ALL-TIME HIGH in the 5-Year Sovereign Credit Default Swap Rate
Purely for perspective, and comparison, with the understanding that the figures shown below do NOT represent the 'real' nominal debt levels at all, we line up the US population-adjusted equivalent levels for EU debtor nations:
US Population-Adjusted Equivalent Debt
Belgium ... $16.99 trillion
Italy ... $14.62 trillion
Austria ... $13.20 trillion
USA ... $11.72 trillion
France ... 10.97 trillion
Germany ... $7.99 trillion
Spain ... $7.63 trillion
In other words ... the risk linked to Belgium and Austria may be significantly understated, as defined by market pricing ...
... the risk linked to France and Germany might be seriously understated ...
... and the risk profile applied by the markets to Spain might be over-stated.
Hence, markets are anticipating another cut in the European Central Bank's official short-term interest rate (the Two-Week Repo), with the March futures contract on the 3-Month Euribor Deposit Rate priced to expect a rate cut in the 1Q of next year ...
... and ... the yield on the 2-Year German Schatz trading back down towards its ALL-TIME LOW, last at 0.84%.
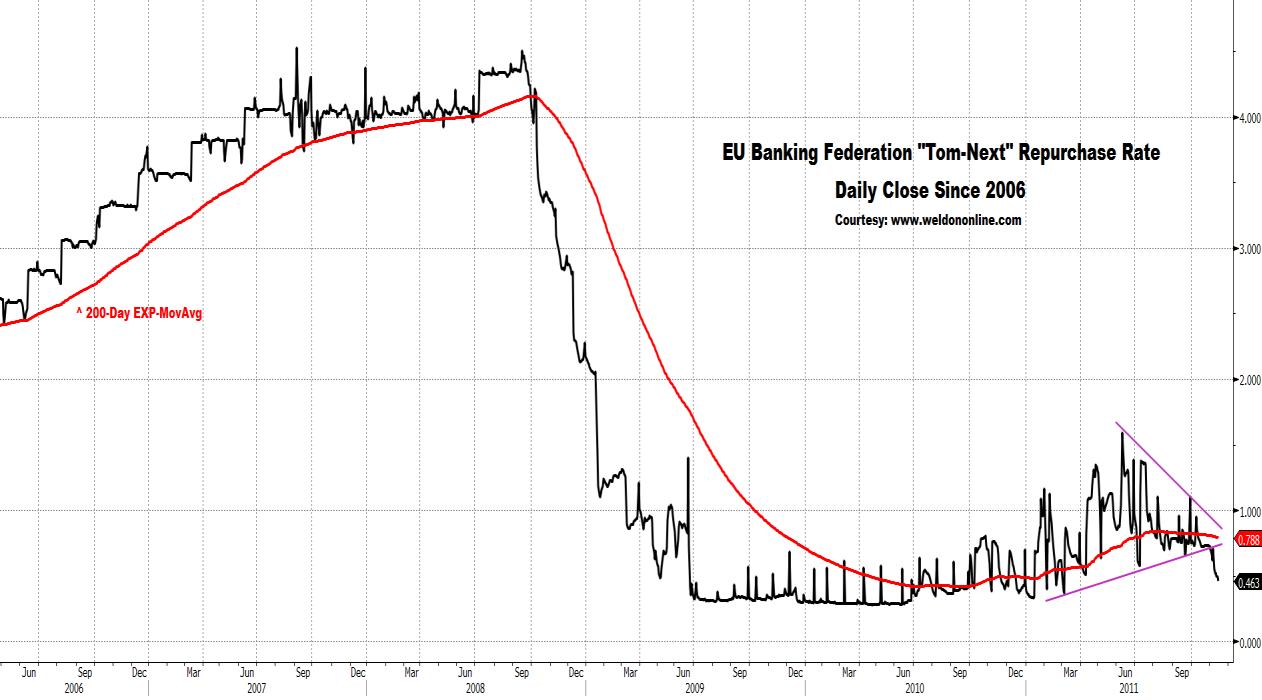
We observe the chart below revealing the breakdown in the "Tom-Next" Repurchase Rate (overnight), which has plunged from above 1.00% in late September, to just 0.46% as of this morning. We focus on the violation of, and downside directional reversal by, the long-term trend defining 200-Day Exponential Moving Average.
Subsequently, and in synch with a post-QE-II rise in US LIBOR ...
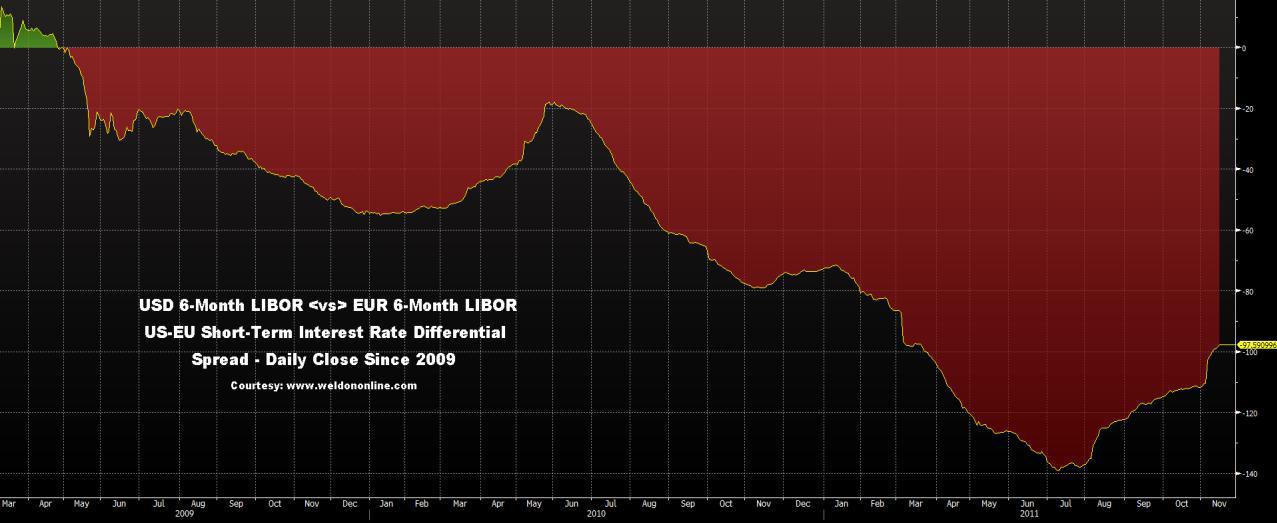
... the US-EU short-term (6-Month) interest rate 'differential' has reversed course, ending a multi-year trend towards a deepening US interest rate discount (EU rate premium) ...
... and shifting to a narrowing in the spread, whereby (rising) US rates are closing the negative gap, relative to (declining) EU short-rates.
Amid all the chaos, and the crashing of the giant waves ...
... short-term interest rate differentials remain a critical factor behind movements in the currency market.
We continue to believe that the Eurocurrency is living on borrowed time.
Evidence the chart on display below plotting the Eurocurrency versus the US Dollar, revealing today's slide, and the increasingly precarious technical status of the European currency. The three moving averages (the 50-Day EXP-MA, the 100-Day EXP-MA, and the 200-Day EXP-MA) are now fully aligned to the bearish side, and all three are accelerating lower, in synch with the increasingly negative reading generated by the long-term Oscillator.
A move below 1.3483 would be very negative, technically speaking.

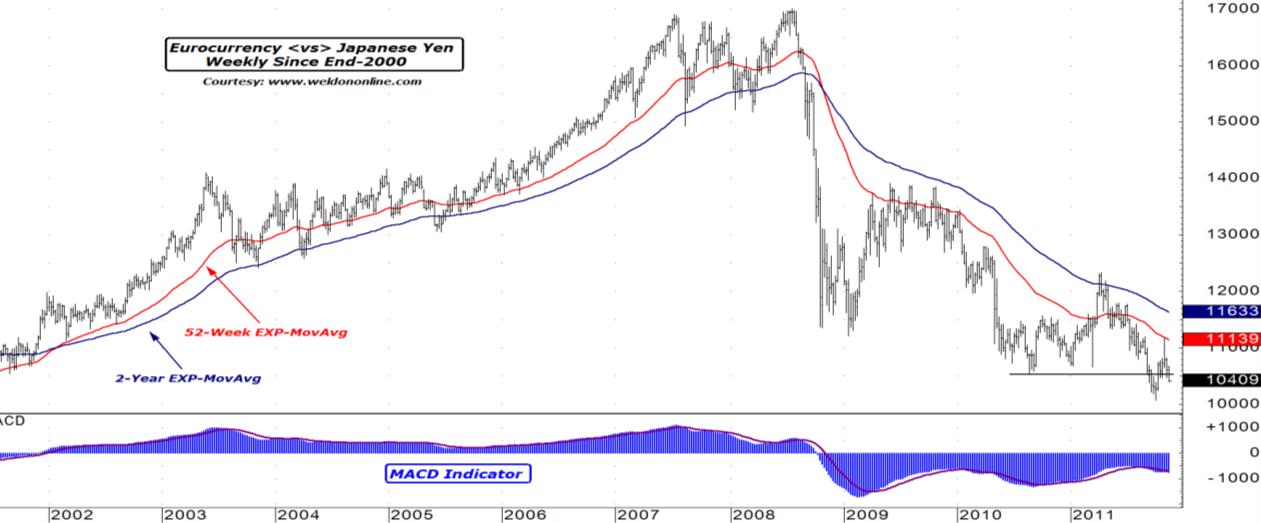
We also note the weakness in the Eurocurrency, as it relates to the Japanese Yen, as evidenced in the long-term weekly chart of EUR-JPY seen below.
We focus on the rejection of the recent rally attempt, in synch with open market intervention in the Yen by Japanese officialdom ... dead-on the long-term 52-Week EXP-MA, and the subsequent renewed downside break below the 105 yen-per-euro level. Further, we focus on the downside acceleration in both moving averages, and the renewed bearish alignment seen in the MACD indicator.
We continue to be somewhat surprised at the level of denial, and/or complacency, that remains dominant, as it pertains to the sentiment surrounding the core European stock markets, particularly the German DAX.
Still, the intermediate-to-longer-term bearish technical dynamic obtains, as evidenced in the chart below. We focus on the bearish interplay between the Index and the moving averages, in synch with the fact that the recent rally was soundly rejected at the long-term 200-Day EXP-MA, in the zone created by the 50% and 61% Fibonacci retracement levels, relative to the 2011 bear market breakdown. And, we note the negative reading offered by the long-term Rate-of-Change indicator.
A move below 5,666 would re-open the downside door. On the flip-side, it takes a move above 6,442 is required to negate our negative outlook, at least from a technical perspective.

In harmony with our thoughts linked to the potential for a rally in the US Dollar, and renewed wealth deflation in global equities ... we note other market 'tells' which are implying a similar macro-market outcome.
First we observe the action in the German Yield Curve, which, in synch with the counter-regional decline in nominal yields ... is ... flattening ... as evidenced in the long-term weekly chart on display below, in which we plot the spread between the German 10-Year Bund, and the 2-Year Schatz. We focus on the renewed widening in the 'negative' moving average gap, in concert with a violation of the uptrend in place since last year (not shown), along with the rollover and slide back into overtly bearish (flattening) territory by the long-term Oscillator.
In fact, most EVERY Yield Curve in the EU is flattening, or inverted, a fact that speaks for itself, in terms of the potential macro-impact of a broadening in the intensified austerity campaign taking hold in the region, a dynamic that is only exacerbated by the rise in absolute yields.

And we note the CRB Index of commodities prices, shown in the chart below.
We focus on the rejection of the recent rally, which took place in line with the convergence of the 3Q swing low, and the short-term 50-Day EXP-MA. Indeed, the moving average dynamic has completed the 'full-blown' shift into a bearish 'alignment', in synch with the slide into bearish territory by the longer-term 200-Day Rate-of-Change indicator.

The outlier is Gold.
Evidence the push towards a renewed upside breakout in Gold 'priced-in' Eurocurrency, as seen in the daily chart on display below. We focus on the resumption of an uptrend in the short-term 50-Day EXP-MA, and renewed bullish alignment and expansion in the trio of moving averages.
We also note the violation of overhead resistance, and the renewed bullish signal emanating from the long-term MACD indicator.
We have been, and we remain ... bullish on Gold 'in' EUR.

Indeed, it is not so much that Gold is making new highs in Euro terms.
It is FAR MORE 'about' the decline in the European currency, relative to Gold.
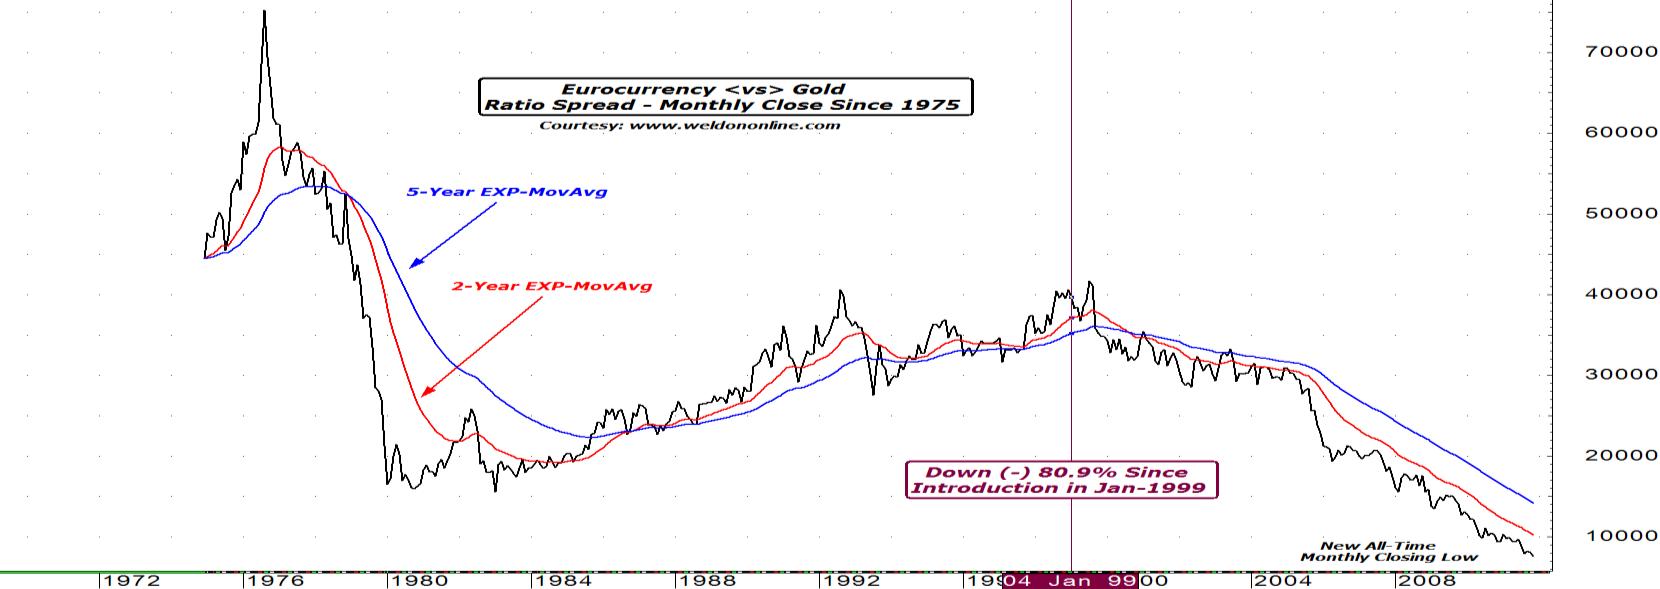
Eye-opening is the chart perspective offered below, as we examine the 'value' of the Eurocurrency when it is 'adjusted by' the price of Gold.
Simply, the EUR is at a NEW ALL-TIME LOW ... and ... has depreciated by a mind-boggling (-) 80.9%, relative to the price for an ounce of Gold, since the single-currency was 'officially' introduced in January of 1999.
Tsunami warnings have been 'sounding' for months, if not years.
In fact, the warnings have become so frequent ...
... and so loud, that market participants appear to have become immune to the daily sound of the sirens.
The wave continues to approach, gaining in size and speed as it approaches the shores defined by the EU debt, equity, and currency market(s).
EU officialdom is hoping to be able to continue surfing this wave, staying ahead of the violent white water that is capable of ripping limbs from the body of the European Union.
We think EU officialdom stands virtually NO chance ...
... or staying on the surfboard.
We remain predisposed to a bearish stance on global equities, focusing on the 5,666 level in the German DAX.
We are, again, bearish on the Eurocurrency versus the USD, and Gold.
We remain bearish on fixed-income markets linked to fiscally-challenged EU member nations ... and bullish on Australian, US, and German fixed-income markets, with a sidelight shining on the US Yield Curve, and a potential breakout in the implied yields attached to the deferred Eurodollar Deposit Rate futures contracts.
We remain predisposed to a bearish stance in select commodities markets, with focus on Industrial Metals, and Agricultural-Tropical commodities such as Sugar, Cotton, Cocoa, and Coffee.
And we remain bullish on surfing.
From the new world record holding giant-wave surfer Garrett McNamara ...
... "I'm not sure I'd want to ride that peak again."
Indeed, we are SURE Europe is wishing they did not have to ride this peak ...
... at all.
But alas, while Garrett rode his giant wave by choice, Europe has NO choice but to ride, until it gets knocked off the board.
... on November 1st, in Nazare Portugal, 70 miles north of Lisbon, an ocean side town know for the giant waves generated by a freakish 1000 foot deep canyon that runs right along the cliffs that mark the shore line ... American surfer Garrett McNamara 'caught' a 90-foot wave, and 'rode' it to 'completion', setting a new world's record for the largest wave ever 'surfed'.
Long time readers know my passion for surfing, at least in my younger days (though I do note that McNamara, born in Massachusetts's, is no teenager, at age 44).
So, what, exactly, does this story have to do with Europe ???
Simple.
Europe is trying to 'ride' a tsunami of debt.
Europe has climbed up on its surfboard, and is attempting to set a world record, for successfully staying ahead of the largest peaking-and-curling wave of sovereign debt ever encountered.
Europe is hoping to emerge from the violently churning white water, at the end of the wave, as did McNamara.
The PROBLEM is ... that the EU debt wave ... is a TSUNAMI.
The wave the EU is attempting to ride, is FAR larger than ... 90-feet.
We note comments on the size and power of the wave, from McNamara ...
... "I just didn't realize how big it was. So I started and I kept going down and down, and the drop seemed like forever, and I thought, wow. I started making the bottom turn, and felt the lip hit me. You can see it in the video. You see me look around twice, and then I get hit by the white water on the shoulder, and it feels like a ton of bricks, and I am thinking, I've gotta make this. I've seen waves rip guy's arms off, and I am thinking this thing could tear my head off."
Indeed, the EU debt-tsunami is threatening to rip Europe's head off.
There is NO surfing a tsunami.
The tsunami is currently curling ... and ... is ready to roll over and come crashing down ... with ALL of Europe now watching as a wall of water rapidly approaches, ready to knock down countries that have NOT been perceived as being at risk ... such as Austria, France, and Belgium, with Spanish markets getting slammed as well, against a background still defined by the fiasco in Italy.
Observe the GIANT WAVE represented within the chart below in which we plot the two-week nominal percentage change in the yield on the Austrian 5-Year Government Bond, which has SOARED by +42.34% in just the last ten trading sessions, EASILY the LARGEST two-week move in Austrian Bonds ...
... EVER !!!!

We are closely monitoring the underlying yield in the Austrian 5-Year Bond, shown in the chart on display below. We focus on the double-bottom below 2%, the more recent upside breakout, and the move above the long-term trend defining 200-Day EXP-MA.
A violation of the YTD high of 3.21% constitutes a major upside breakout.

Our trusty data-scalpel in hand, we carve into the debt dynamic to generate a sense for the size of the tsunami.
Austrian's sovereign debt outstanding that matures by 2035 (all figures include interest payments due) is 'only' EUR 255.7 billion (or, $346.3 billion), laid out as noted in the chart on display below (courtesy Bloomberg)... with $137.5 billion coming due in the next four years.
No big deal, right ??? A neophyte could surf that wave, right ???
WRONG.
When we 'adjust' the size of Austria's debt, by the population, and compare it to the US population-equivalent debt ...
... we find that Austria's debt is LARGER than the US Treasury's debt, with the US-population adjusted size of Austria's outstanding debt pegged at $13.2 trillion, exceeding the $11.7 trillion in US Treasury debt outstanding.
On a 'population-adjusted-basis', Austria's debt is Europe's THIRD LARGEST.

With that in mind, we note the chart below, plotting the 5-Year Sovereign Credit Default Swap Rate linked to Austrian government debt

We ask ... how many Austrian citizens know how to surf ???
We wonder, how many Belgians ... know how to surf ???
It could be a major problem, if people in these two countries do not know how to surf, given the height of the debt tsunami bearing down on them. We laid out this case in our September 6th Money Monitor, "Mardi ??, c'est done la Belgique", or, "If it's Tuesday, This Must Be Belgium", in which we compared Belgium's sovereign debt to Italy's, with a spotlight on the Belgian 2-Year Bond Yield, then at 2.58%. Today the Belgian 2-Year Bond Yield surged to a new move high of 3.71%, as seen in the chart below, after exploding upwards and violating overhead resistance defined at the previous YTD high of 2.70%.
Since our Money Monitor focus, the Belgian 2-Year Yield has risen by +43.8%.

Applying the same population-equivalent perspective as with Austria, to Belgium, we note the following 'macro-mathematics' ... outstanding sovereign debt (and interest payments) of EUR 419.5 billion, or $ 564.2 billion ... which, adjusted to a US-population 'equivalent' ...
... equals ... $16.99 trillion !!!!
On a 'population-adjusted-basis', Belgium's debt is Europe's LARGEST ... and ... one of the LARGEST in the WORLD.
With that in mind, we note the chart below, and the new ALL-TIME HIGHS in the 5-Year Belgian Sovereign Credit Default Swap Rate.

Do the French ... surf ???
"Je crois que non" !!!!
(I don't think so !!!)
French Bond yields SOARED this morning, with the 5-Year yield reaching 2.69%, rising by an eye-opening +36 basis points today alone ... and ...
... representing an ominously large single-day nominal increase of +15.5%
Technically speaking we focus on the massive double-bottom pattern, along with the upside violation of the long-term trend defining 200-Day EXP-MA, and, today's penetration of the downtrend line in place since the 2008 high.

With EUR 1.7 trillion, or, $2.2865 trillion in debt outstanding ...
... which calculates to a US-population-adjusted equivalent debt of $10.97 trillion ...
... we note today's push to a NEW ALL-TIME HIGH in the 5-Year Sovereign Credit Default Swap Rate linked to the French government.

Spain has been a media-focus ... but the spotlight should be on Austria, Belgium, and France, with Spain pulling up the rear.
Spain carries debt of EUR 848.3 billion (including interest payments, based on current bond yields) ... or ... $1.141 trillion ...
... 'equal' to $7.633 trillion in US-population adjusted terms, putting it below Belgium, Italy, Austria, France, and Germany.
Still, Spanish bond yields are SOARING, and breaking out technically to a significantly greater degree than are yields in other countries (other than Italy and Greece) ... having already violated their mid-2008 highs ...
... as evidenced in the chart on display below.
At the current new multi-year high of 5.23% ... the Spanish 2-Year Bond yield has risen by +311.8% since bottoming in the summer of 2009 at 1.27%.

And, as seen in the chart on display below, France is NOT immune to thoughts of a debt default, as defined by today's surge to a NEW ALL-TIME HIGH in the 5-Year Sovereign Credit Default Swap Rate

Purely for perspective, and comparison, with the understanding that the figures shown below do NOT represent the 'real' nominal debt levels at all, we line up the US population-adjusted equivalent levels for EU debtor nations:
US Population-Adjusted Equivalent Debt
Belgium ... $16.99 trillion
Italy ... $14.62 trillion
Austria ... $13.20 trillion
USA ... $11.72 trillion
France ... 10.97 trillion
Germany ... $7.99 trillion
Spain ... $7.63 trillion
In other words ... the risk linked to Belgium and Austria may be significantly understated, as defined by market pricing ...
... the risk linked to France and Germany might be seriously understated ...
... and the risk profile applied by the markets to Spain might be over-stated.
Hence, markets are anticipating another cut in the European Central Bank's official short-term interest rate (the Two-Week Repo), with the March futures contract on the 3-Month Euribor Deposit Rate priced to expect a rate cut in the 1Q of next year ...
... and ... the yield on the 2-Year German Schatz trading back down towards its ALL-TIME LOW, last at 0.84%.
We observe the chart below revealing the breakdown in the "Tom-Next" Repurchase Rate (overnight), which has plunged from above 1.00% in late September, to just 0.46% as of this morning. We focus on the violation of, and downside directional reversal by, the long-term trend defining 200-Day Exponential Moving Average.

Subsequently, and in synch with a post-QE-II rise in US LIBOR ...
... the US-EU short-term (6-Month) interest rate 'differential' has reversed course, ending a multi-year trend towards a deepening US interest rate discount (EU rate premium) ...
... and shifting to a narrowing in the spread, whereby (rising) US rates are closing the negative gap, relative to (declining) EU short-rates.

Amid all the chaos, and the crashing of the giant waves ...
... short-term interest rate differentials remain a critical factor behind movements in the currency market.
We continue to believe that the Eurocurrency is living on borrowed time.
Evidence the chart on display below plotting the Eurocurrency versus the US Dollar, revealing today's slide, and the increasingly precarious technical status of the European currency. The three moving averages (the 50-Day EXP-MA, the 100-Day EXP-MA, and the 200-Day EXP-MA) are now fully aligned to the bearish side, and all three are accelerating lower, in synch with the increasingly negative reading generated by the long-term Oscillator.
A move below 1.3483 would be very negative, technically speaking.

We also note the weakness in the Eurocurrency, as it relates to the Japanese Yen, as evidenced in the long-term weekly chart of EUR-JPY seen below.
We focus on the rejection of the recent rally attempt, in synch with open market intervention in the Yen by Japanese officialdom ... dead-on the long-term 52-Week EXP-MA, and the subsequent renewed downside break below the 105 yen-per-euro level. Further, we focus on the downside acceleration in both moving averages, and the renewed bearish alignment seen in the MACD indicator.

We continue to be somewhat surprised at the level of denial, and/or complacency, that remains dominant, as it pertains to the sentiment surrounding the core European stock markets, particularly the German DAX.
Still, the intermediate-to-longer-term bearish technical dynamic obtains, as evidenced in the chart below. We focus on the bearish interplay between the Index and the moving averages, in synch with the fact that the recent rally was soundly rejected at the long-term 200-Day EXP-MA, in the zone created by the 50% and 61% Fibonacci retracement levels, relative to the 2011 bear market breakdown. And, we note the negative reading offered by the long-term Rate-of-Change indicator.
A move below 5,666 would re-open the downside door. On the flip-side, it takes a move above 6,442 is required to negate our negative outlook, at least from a technical perspective.

In harmony with our thoughts linked to the potential for a rally in the US Dollar, and renewed wealth deflation in global equities ... we note other market 'tells' which are implying a similar macro-market outcome.
First we observe the action in the German Yield Curve, which, in synch with the counter-regional decline in nominal yields ... is ... flattening ... as evidenced in the long-term weekly chart on display below, in which we plot the spread between the German 10-Year Bund, and the 2-Year Schatz. We focus on the renewed widening in the 'negative' moving average gap, in concert with a violation of the uptrend in place since last year (not shown), along with the rollover and slide back into overtly bearish (flattening) territory by the long-term Oscillator.
In fact, most EVERY Yield Curve in the EU is flattening, or inverted, a fact that speaks for itself, in terms of the potential macro-impact of a broadening in the intensified austerity campaign taking hold in the region, a dynamic that is only exacerbated by the rise in absolute yields.

And we note the CRB Index of commodities prices, shown in the chart below.
We focus on the rejection of the recent rally, which took place in line with the convergence of the 3Q swing low, and the short-term 50-Day EXP-MA. Indeed, the moving average dynamic has completed the 'full-blown' shift into a bearish 'alignment', in synch with the slide into bearish territory by the longer-term 200-Day Rate-of-Change indicator.

The outlier is Gold.
Evidence the push towards a renewed upside breakout in Gold 'priced-in' Eurocurrency, as seen in the daily chart on display below. We focus on the resumption of an uptrend in the short-term 50-Day EXP-MA, and renewed bullish alignment and expansion in the trio of moving averages.
We also note the violation of overhead resistance, and the renewed bullish signal emanating from the long-term MACD indicator.
We have been, and we remain ... bullish on Gold 'in' EUR.

Indeed, it is not so much that Gold is making new highs in Euro terms.
It is FAR MORE 'about' the decline in the European currency, relative to Gold.
Eye-opening is the chart perspective offered below, as we examine the 'value' of the Eurocurrency when it is 'adjusted by' the price of Gold.
Simply, the EUR is at a NEW ALL-TIME LOW ... and ... has depreciated by a mind-boggling (-) 80.9%, relative to the price for an ounce of Gold, since the single-currency was 'officially' introduced in January of 1999.

Tsunami warnings have been 'sounding' for months, if not years.
In fact, the warnings have become so frequent ...
... and so loud, that market participants appear to have become immune to the daily sound of the sirens.
The wave continues to approach, gaining in size and speed as it approaches the shores defined by the EU debt, equity, and currency market(s).
EU officialdom is hoping to be able to continue surfing this wave, staying ahead of the violent white water that is capable of ripping limbs from the body of the European Union.
We think EU officialdom stands virtually NO chance ...
... or staying on the surfboard.
We remain predisposed to a bearish stance on global equities, focusing on the 5,666 level in the German DAX.
We are, again, bearish on the Eurocurrency versus the USD, and Gold.
We remain bearish on fixed-income markets linked to fiscally-challenged EU member nations ... and bullish on Australian, US, and German fixed-income markets, with a sidelight shining on the US Yield Curve, and a potential breakout in the implied yields attached to the deferred Eurodollar Deposit Rate futures contracts.
We remain predisposed to a bearish stance in select commodities markets, with focus on Industrial Metals, and Agricultural-Tropical commodities such as Sugar, Cotton, Cocoa, and Coffee.
And we remain bullish on surfing.
From the new world record holding giant-wave surfer Garrett McNamara ...
... "I'm not sure I'd want to ride that peak again."
Indeed, we are SURE Europe is wishing they did not have to ride this peak ...
... at all.
But alas, while Garrett rode his giant wave by choice, Europe has NO choice but to ride, until it gets knocked off the board.
