On January 1st of 2002 the 'modern era' Eurocurrency was first 'issued' in the form of banknotes and coins. The European Central Bank is participating in a celebration of this historic event, with a campaign entitled ...
... "Generation Europe"
The question is, will the EUR ... be a one-hit wonder?
Is Generation Europe to be ... one-decade-and-done?
This is THE question being asked.
In fact, in a poll published yesterday by Bloomberg, we note the following:
Question: When, if ever, will one or more nations drop out of the euro zone ?
Within the Next Year ... 46%
Within 2-5 Years ........ 32%
Longer than 5-Years .... 4%
Never .................... 14%
Question: When, if ever, will there be a financial melt-down in the European banking sector ?
Within the Next Year ... 43%
Within 2-5 Years ........ 25%
Longer than 5-Years .... 7%
Never ........................ 18%
The risk of the latter, a melt-down in the banking sector has become SO TANGIBLE as to induce the Federal Reserve to action, in order to insure adequate liquidity.
Indeed, according to the latest weekly data released on Wednesday, European Central Bank 'demand' for 3-Month USD loans via the Federal Reserve's Dollar Liquidity Swap facility surged in the week since the US Central Bank slashed the interest rate it charges financial institutions for such loans. The ECB said it disbursed $50.7 billion in 84-day loans to a whopping 34 European banks, at a rate of 0.59% ...
... an increase of +1273.5% versus the previous ECB offering on November 9th, when the European Central Bank disbursed a paltry $395 million at the pre-cut rate of 1.09%.
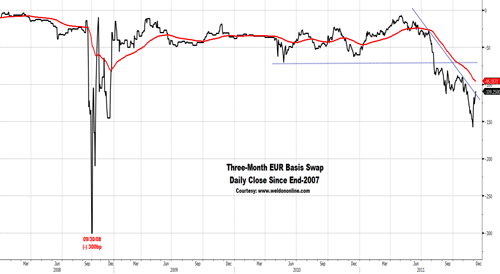
We shine the spotlight on the chart below reflecting the 'dissipation' of SOME of the 'anxiety linked to European financial institutions and their 'USD funding' needs, as defined by the 'rise' (narrowing) in the 3-Month 'Cross Currency Basis Swap', a function of less-intense pressure on banks to borrow USD. Indeed, coincidentally, or not, the 3-Month EUR-USD Basis Swap has rallied by +49 basis points, a single tic less than the cut to the USD Liquidity Swap facility cost, enacted by the Fed last week.
The market will need to 'prove itself' capable of 'supporting' a further 'narrowing' in the Basis Swap, with the 3-Month Rate needing to clear the med-term trend defining 100-Day EXP-MA (minus 95bp), and the overhead resistance represented by the September lows (minus 60bp), before officialdom can claim a victory over illiquidity.
Moreover, until today, the markets had been chasing the monetary 'carrot' being carried around by the European Central Bank. We note comments made last week by ECB President Mario Draghi ...
... "The ECB's goal is to maintain price stability in either directions. This applies to both the setting of official interest rates and the implementation of non-standard measures."
But, the non-standard measures being considered have become increasingly "standard", with thoughts of 'loosening' collateral requirements for liquidity operations FAILING to qualify as 'quantitative easing'.
Indeed, when if it was possible that the ECB would pursue non-sterilized debt monetization as a policy, following the lead of the US Fed, the ECB President was straight up when he replied, with a hint of a smile ...
... "No".
Further, when asked if the ECB had discussed cutting their official short-term interest rate (2-Week Repo) by MORE than (-) 25 basis points, Draghi replied, simply ...
... "No"
And, when asked if the decision to cut rates was unanimous, he replied ...
.... "No".
In other words ... dissent on the ECB ... skewed towards NO cut in rates.
In fact, I watched the press conference, live, and witnessed Draghi's 'affect', and heard his exact words. Simply stated, the ECB President was smooth and matter-of-a-fact, in his delivery, with the stone-cold persona of an old-school, Generation Europe, Central Banker ...
... "No monetary finance of governments."
Repeatedly, Draghi stated that "the treaty" (referring to the Maastricht Treaty on European Union) represents a 'legal contract', which implicitly and specifically PROHIBITS the "monetary finance of governments".
Draghi threw the crisis right back into the laps of the politicians, calling for a "new contract", one which implements more stringent "hard" limits on debts and deficits, with "harsh penalties" to be imposed on offenders.
Ahem, ummmmm, errrrrr ... don't they already have that ???
Of course they do. The Maastricht Treaty very specifically and consciously laid out "hard caps" on the total sovereign debt (60% of GDP) of individual member nations, and on the annual deficits (3% of GDP), with "harsh penalties" to be imposed on offending nations.
Indeed, 25 of 27 EU-member nations, including Germany, are currently in violation of Maastricht Treaty 'hard caps' on debt, deficits, or both, in a situation that has evolved over YEARS of non-compliance ...
... and not a SINGLE PENALTY has ever been imposed.
This Treaty is already ... worthless.
Thinking a new treaty will provide a solution to the CURRENT and IMMEDIATE crisis involving the need for governments (and banks) to meet refunding requirements estimated at near $2 trillion in the next 13 months ...
... does NOT 'compute', time wise.
Sure, a "new contract" might be the answer ...
... for the "Next Generation Europe".
And, yes, a "new contract" might 'allow', and thus facilitate, Central Bank debt monetization, as a support mechanism to help offset the natural deflationary impact yet to be generated via intensified fiscal austerity.
But politically speaking, in terms of the need for ratification by EVERY member nation, and a tectonic shift in the German political stance ...
... let alone the potential for public debate ...
... a "new contract" will take a LONG TIME to 'execute'.
TOO LONG, to be looked at as a solution.
The ECB just SLAMMED the door SHUT on a monetary solution ...
... and, threw the ball into the court of "lawyers", in terms of Draghi's repeated mention that implementing ANY debt monetization, whether direct via the ECB, or through the back-door, via member nation Central Banks, borrowing from the IMF. The ECB is implicitly opposed to such a move.
Indeed, if the EU were to pursue a back-door Central Bank solution, the US would be on the 'hook' for $135 billion of the (proposed) $750 billion support package.
Frankly, with its own MASSIVE debt refunding requirement exposure in the next 13 months, the US is NOT, fiscally, in a position to spend $135 billion to bailout fiscally irresponsible European nations.
Thus, the BIG problem with an optimistic vision.
Everyone is in the same boat, debt and deficit wise.
NO ONE single country, not even China ... can bail out EVERYONE.
Something's got to give.
VOILA ... pressure is on the build, as evidenced by the mathematics linked to the updated data offered by the ECB on Tuesday, in the form of their Balance Sheet.
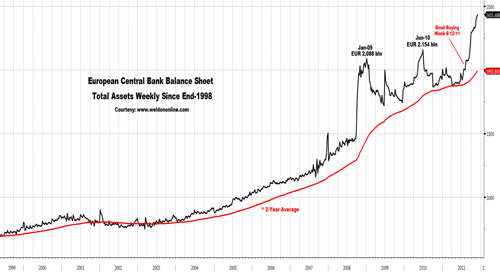
We note the rise in Total Assets to a new record high. Evidence the chart on display below, which speaks for itself with the ECB's Total Assets headed towards EUR 2.5 trillion ... most of which represents intensified distress in the financial sector, via increased borrowing from the Central Bank, bond purchases by the ECB, and the back-handed 'sterilization' of those purchases, which results in higher Deposits.
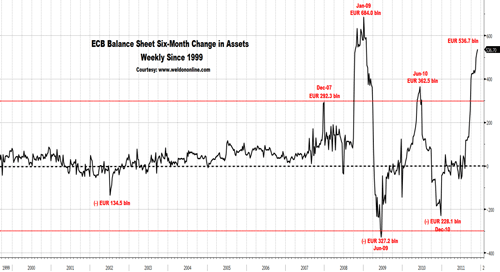
The expansion in the ECB's Balance Sheet has been significant over the last six-months, pegged in the chart below at more than EUR a half-trillion.
Stress on the rise is evidenced by ...
... the rise in ECB Loans to European Credit Institutions.
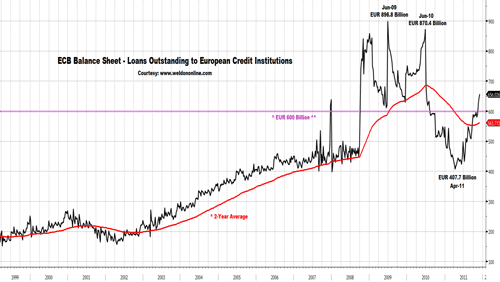
We spotlight the chart on display below plotting the ECB's Balance Sheet entry for Loans Outstanding to European Credit Institutions (ie: banks), with focus on the recent renewed surge to more than EUR 600 billion in the latest reporting week. We observe that previous periods when the total exceeded EUR 600 billion, can be associated with times when macro-market turbulence is also 'on the rise'.
In that vein, we note the (previous) violation of, and more recent upside directional reversal by ... the long-term 2-Year Moving Average.
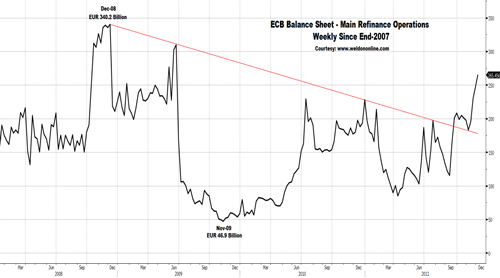
Similarly, we focus attention on the chart below plotting the ECB Balance Sheet entry for their Main Refinance Operations ...
... revealing an upside breakout, a sharp rise ...
... and ... a push to the highest level since 2009, at more than EUR 250 billion, a level that has, in the past, been associated with periods of heightened anxiety, as it relates to the 'health' of the EU banking system, and by extension, the EUR.
As per the data released on Wednesday, once again, as expected, the ECB drained liquidity from the banking system, to the same degree that liquidity was added by ECB purchases of sovereign debt ... thus, continuing their program of 'sterilizing', or neutralizing, the monetary policy impact of open market bond buying.
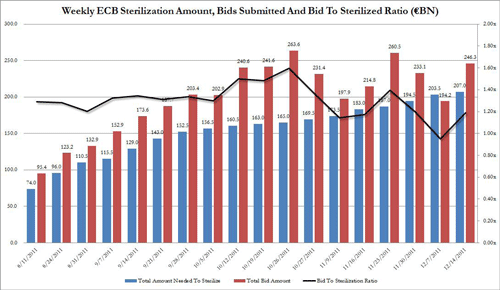
In the week-ended-Dec-6th, the ECB received bids for EUR 246.34 billion in 7-Day Deposits, and 'allotted' EUR 207 billion at a Weighted Average Allotment Rate of 0.65% (Marginal Rate of 1%) ... for a bid-to-cover of 1.19%, thus allowing the ECB to 'meet' that week's 'sterilization requirement'.
Such was NOT the case last week, when demand for Deposits was insufficient to 'meet' the ECB's needs, as evidenced in the chart below (courtesy of Tyler Durden, and zerohedge.com), plotting the amount that the ECB needs to sterilize on a weekly basis (blue line), versus the amount that banks bid for each week (red line). We focus on last week's 'failed' auction, which, if repeated, would represent UN-STERILIZED intervention, even if (allegedly) unintentional.
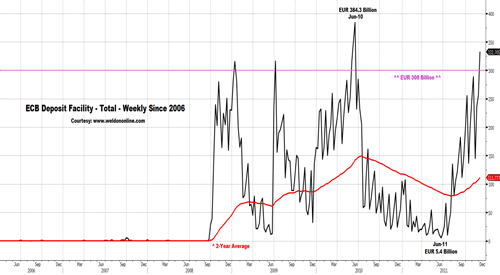
Subsequently, Deposits at the ECB have soared again, expanding to more than EUR 300 billion for the first time since the middle of last year, reflective of the 'sterilization', and indicative of the intensified stress in the banking system.
Emerging from the maze that is the ECB's Balance Sheet, and bond buying policy protocol, we note intriguing commentary from Miguel Carrion Alvarez of eurointelligence.com ...
... "There's no way that the ECB bond purchases can be inflationary, quite the contrary. In effect, the ECB is taking money from the private banks with one hand in order to buy bonds off them with the other.
Since these bonds are already eligible collateral for the weekly ECB refinancing operations, buying the bonds has nearly no monetary impact, so coupled with the weekly deposit-taking the net effect is contractionary.
It is even possible that the same banks are selling bonds to the ECB and putting the proceeds in ECB deposits, which would imply that the ECB is paying the private banks a premium for the privilege of storing their sovereign bonds.
Given that the ECB is paying up to 1% for the offsetting deposits instead of charging 1% in its refinance operations, each failure of sterilization indicates that the ECB was trying to drain more than the entire spare liquidity of the private banking system for one-week lending. That this spare liquidity is less than €80bn should give the inflation hawks pause." ---
There may be the appearance of a liquidity flood ...
... but there is no doubt about the macro-economic drought !!!
For sure, the inflation hawks must take pause nearly every time macro-economic data is released in the EU.
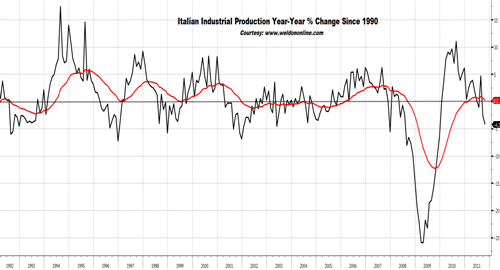
This is particularly true when it applies to data from Italy. We note yesterday's release of October's Industrial Production data, revealing a second consecutive monthly decline, and the fifth decline in the last six months. Industrial Output contracted by (-) 0.9% for the month, driving the year-over-year rate-of-change DEEPER into NEGATIVE territory ... pegged at (-) 4.2% ... down from (-) 2.7% yr-yr in September ... and a complete reversal from the +4.7% yr-yr growth rate seen in August.
Evidence the chart on display below revealing the worst performance since 2009, a downside violation of the 2-Year Moving Average, and the downside reversal, directionally, by the Average.
Digging deeper into the data, we can deduce that the decline in Italian Industrial Production was BROAD based, by sector. Evidence the data details on display below, defined by October's year-over-year change:
Breaking it down even further, we note the following data dissected by 'product', and exhibiting both the monthly change, and the year-year rate:
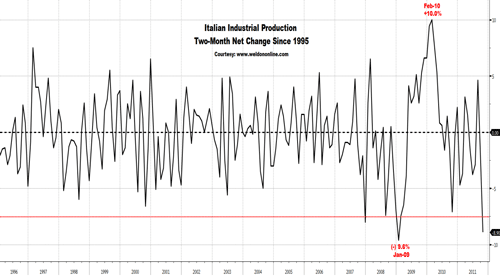
Indeed, in the last two months alone, the year-over-year Rate-of-Change in total Italian Industrial Production has PLUNGED by a whopping (-) 8.9 percentage points ... representing the second LARGEST EVER back-to-back monthly DECLINE in the 12-month rate of change, behind only the back-to-back erosion posted at the height of the 2008-09 crisis ...
... as evidenced in the chart on display below.
Also, as we have previously discussed ... the EU debt-deficit-debacle has not only begun to mutate, into an EU credit crunch (as evidenced by the contraction in loans to households, and the bank funding fiasco) ... and ... has backfired into the global economy, via lower domestic EU final demand.
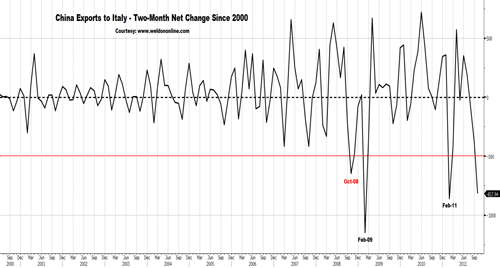
We have already dissected the Chinese trade data for October, but a replay is in order ... as implied by the DRAMATIC picture presented in the chart below, in which we plot the back-to-back net change, in USD, in China's monthly Exports to Italy.
In short ... the decline in September-October, pegged at (-) $817.94 million 'per month' in Exports from China to Italy, is THE LARGEST EVER back-to-back monthly declines that were not linked to the Jan-Feb Lunar New Year Holiday in China ... EASILY exceeding the largest ever two-month decline, posted during the 2008-09 global crisis, in September-October 2008.
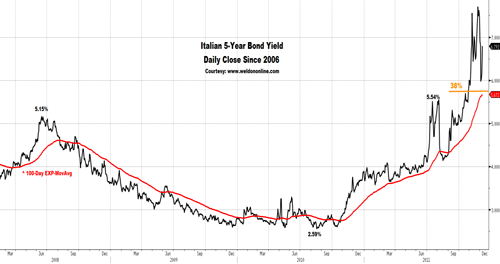
But there is NO relief to be gleaned from the deflationary macro-environment, as it relates to the Italian Bond market, where yields are once again SOARING, on the back of bitter disappointment linked to today's ECB meeting, and the lack of new bond buying initiatives. Note the chart below revealing that the Fed Swap bombshell impact on the Italian Bond market (ie: lower yields) failed to even amount to a 38% Fibonacci retracement relative to the entire crisis induced rise.
It's STILL ... 'game on', in the Italian debt market.
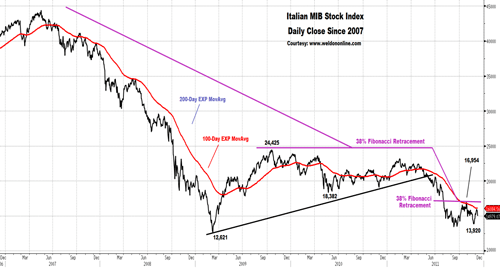
And thus, it is STILL 'game on' in the Italian stock market, with downside pressure remaining the dominant force, as evidenced by today's deep post-ECB meeting decline of more than (-) 4%.
Once again we spotlight the chart below plotting the Italian MIB stock index, revealing that the recent rally has now, twice, been soundly rejected at overhead resistance marked by the med-term trend defining 100-Day Exponential Moving Average, in line with last month's rally to the 38% Fibonacci retracement level, relative to the decline since last September.
Clearly, a move below 13,920 would be MOST negative, technically, and would open the door for a serious test of the 1Q-2009 secular low.
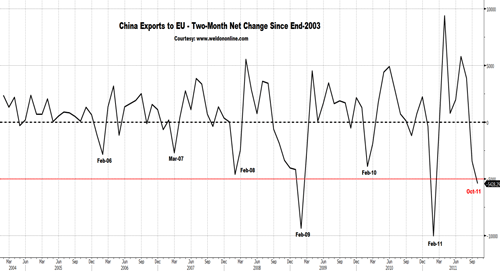
More broadly, we note the chart below plotting the back-to-back monthly net change, in USD, in Chinese Exports to the European Union ... which plunged by $2.873 billion, or (-) 9.1%, in October alone.
We note that during the Sept-Oct two-month period, Chinese Exports to the EU plummeted by nearly (-) $5.5 billion, PER MONTH, for a nominal contraction of (-) 15.9%. This decline, as noted in the chart, represents the LARGEST EVER two-month contraction in Chinese Export to the EU, excluding the normal, seasonal decline posted every year in Jan-Feb, in conjunction with China's Lunar New Year holiday.
We can identify the same macro-trade-dynamic on the European side of the equation, as evidenced in the French trade data for October, published yesterday morning.
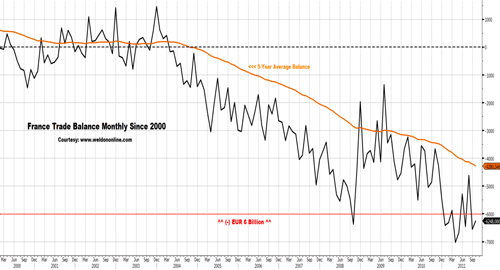
In fact, as evidenced in the chart below, the French Trade Deficit actually narrowed slightly for the month, albeit minimally, on the back of LOWER IMPORT DEMAND, as per a (-) EUR 129 million monthly decline.
Still, France's Trade Deficit of (-) EUR 6.248 billion is HUGE, with seven out of the last ten months producing a deficit in excess of (-) EUR 6 billion. We also observe the trajectory of the secular trend defining 5-Year Average, which reached a NEW ALL-TIME LOW in the most recent month.
Indeed, the current circumstance looks demonstrably WORSE than in 2008.
French markets remain at risk, case closed.
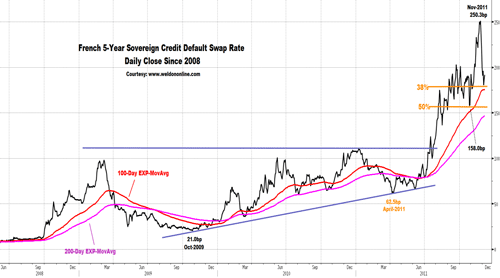
We note the 5-Year Sovereign Credit Default Swap Rate, seen in the daily chart on display below, with focus on the most recent decline, which maps out a text-book 'corrective' move, as per support defined by yesterday's low, and the technical convergence of the med-term 100-Day EXP-MA, and the 38% Fibonacci retracement level relative to the rise since the April low.
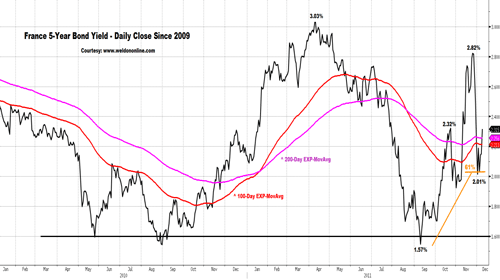
Similarly, while the decline in French Bond Yields has been dramatic ...
... it has remained within the context of a 'correction' in an ongoing bond bear market (higher yields), as per the recent low at 2.01%, which held the decline at the 61% Fibonacci retracement level relative to the entire 2011 expansion in yields.
Further, with today's post-ECB meeting spike back to the upside in French Bond yields, the yield on the 5-Year OAT has re-engaged the 100-Day and 200-Day EXP MA's in a way that implied intensified odds of a continued rise.
A move back above 2.32% opens the door, technically, for a run at the 2011 YTD high marked at 2.82%.
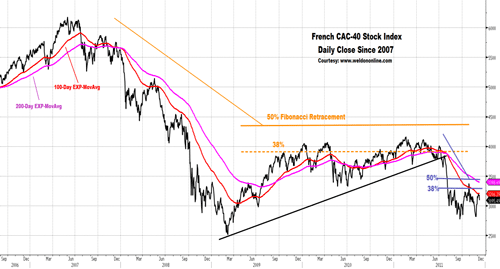
As for the French stock market (CAC-40 Index, as seen in the chart below), it looks eerily similar to the Italian market, in that the recent rally looks like nothing more powerful than a normal corrective recovery, in an ongoing bear market.
We focus on the rejection of the rally in the zone between the 38% and 50% Fibonacci retracement levels, and, the pair of rally rejections noted when the market 'touches' the med-term trend defining 100-Day EXP-MA.
Indeed, the med-term trend defining 100-Day EXP-MA remains bearishly tilted, in a downtrend ... as it has been ... ALL YEAR LONG !!!
The outcome of today's ECB meeting offers validation for our macro-thematic thought process, implying that the ECB is NOT going to be so willing to monetize debt ...
... and while that means the EUR is not under intense debasement pressure, the European currency is lower on the day.
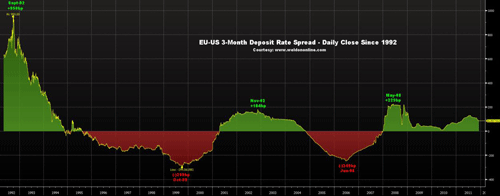
Aside from the powerful macro-economic drought ... we note the influence on the currency to be garnered from the narrowing in the EU-US short-term interest rate differential, as evidenced in the chart shown below.
We shine the spotlight on the 3-Month Deposit Rate Spread, which, in anticipation of, and on the back of, today's rate cut, has extended its move towards a 'more narrow' EU short-term interest rate premium (green shaded, EU rate discount to the US is marked by the red shaded areas).
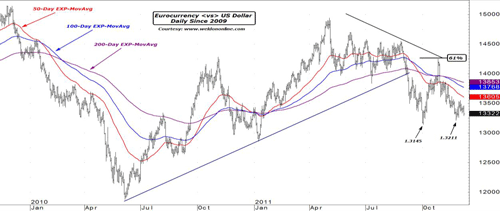
We have been, and are again, overly bearish on the Eurocurrency, particularly relative to the USD.
Evidence the chart below plotting the EU-US currency cross-rate (EUR-USD), revealing that the med-to-longer term picture defined by the moving average momentum and alignment, remains BEARISH, as it has been for the past couple of months. Clearly, a move below the dual-lows marked at 1.3211 and 1.3145 would be technically quite negative.
We expect such a move.
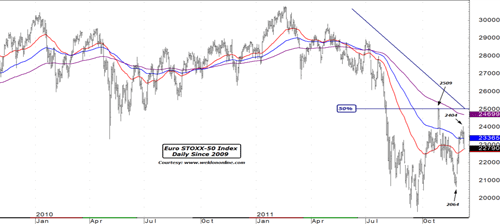
Similarly, we are once again overtly bearish on European stock indexes. '
We shine the spotlight on the price action in the futures contract linked to the Euro-STOXX 50 Index, seen in the chart below. Today's decline is threatening the near-term trend defining 50-Day EXP-MA, after already having violated the 100-Day EXP-MA earlier this morning. It takes a move above the high at 2404 to negate the renewed bearish technical evolution ..
.
... while a move below 2064 would be most negative, technically.
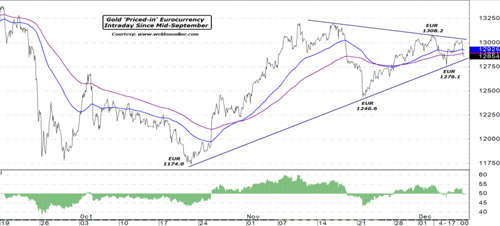
And finally, today's rejection by the ECB, and President Draghi, of ANY type of un-sterilized debt purchases and ANY shift towards the adoption of a 'true' quantitative easing campaign ... has HURT Gold.
We note the short-term intraday chart on display below plotting the price of Gold 'denominated' in EUR, revealing a mini-near-term breakdown, and the expanding risk of a more serious crack in the precious metal.
A move below 1276.1 euro-per-ounce, would be negative, technically.
We have exited our bullish Gold 'in' EUR campaign, and suggest that aggressive, short-term speculative types might consider a short position in USD-priced Gold, as a near-term trade.
"Generation Europe" might survive a decade.
But it is "Next Generation Europe" that is increasingly at risk.
As we have been repeatedly saying, for many months, and in fact, for the better part of two-years ... there will be NO 'easy', or 'quick' solution to the European debt-deficit-debacle.
A reworking of the Union Treaty would take TIME, something the individual governments, and the banks, do NOT possess.
Clearly, it will take MORE PAIN, to generate action significant enough to keep bond yields from rising, and the underlying economy from crashing.
We have used the comparison offered by the Greek Finance Minister early in 2010, when he compared the Greek fiscal situation to the Titanic. We went further, comparing the EU itself, to the Titanic ... a HUGE ship that few thought could ever 'float' in the first place, that is on the verge of SINKING.
... "Generation Europe"
The question is, will the EUR ... be a one-hit wonder?
Is Generation Europe to be ... one-decade-and-done?
This is THE question being asked.
In fact, in a poll published yesterday by Bloomberg, we note the following:
Question: When, if ever, will one or more nations drop out of the euro zone ?
Within the Next Year ... 46%
Within 2-5 Years ........ 32%
Longer than 5-Years .... 4%
Never .................... 14%
Question: When, if ever, will there be a financial melt-down in the European banking sector ?
Within the Next Year ... 43%
Within 2-5 Years ........ 25%
Longer than 5-Years .... 7%
Never ........................ 18%
The risk of the latter, a melt-down in the banking sector has become SO TANGIBLE as to induce the Federal Reserve to action, in order to insure adequate liquidity.
Indeed, according to the latest weekly data released on Wednesday, European Central Bank 'demand' for 3-Month USD loans via the Federal Reserve's Dollar Liquidity Swap facility surged in the week since the US Central Bank slashed the interest rate it charges financial institutions for such loans. The ECB said it disbursed $50.7 billion in 84-day loans to a whopping 34 European banks, at a rate of 0.59% ...
... an increase of +1273.5% versus the previous ECB offering on November 9th, when the European Central Bank disbursed a paltry $395 million at the pre-cut rate of 1.09%.
We shine the spotlight on the chart below reflecting the 'dissipation' of SOME of the 'anxiety linked to European financial institutions and their 'USD funding' needs, as defined by the 'rise' (narrowing) in the 3-Month 'Cross Currency Basis Swap', a function of less-intense pressure on banks to borrow USD. Indeed, coincidentally, or not, the 3-Month EUR-USD Basis Swap has rallied by +49 basis points, a single tic less than the cut to the USD Liquidity Swap facility cost, enacted by the Fed last week.
The market will need to 'prove itself' capable of 'supporting' a further 'narrowing' in the Basis Swap, with the 3-Month Rate needing to clear the med-term trend defining 100-Day EXP-MA (minus 95bp), and the overhead resistance represented by the September lows (minus 60bp), before officialdom can claim a victory over illiquidity.

Moreover, until today, the markets had been chasing the monetary 'carrot' being carried around by the European Central Bank. We note comments made last week by ECB President Mario Draghi ...
... "The ECB's goal is to maintain price stability in either directions. This applies to both the setting of official interest rates and the implementation of non-standard measures."
But, the non-standard measures being considered have become increasingly "standard", with thoughts of 'loosening' collateral requirements for liquidity operations FAILING to qualify as 'quantitative easing'.
Indeed, when if it was possible that the ECB would pursue non-sterilized debt monetization as a policy, following the lead of the US Fed, the ECB President was straight up when he replied, with a hint of a smile ...
... "No".
Further, when asked if the ECB had discussed cutting their official short-term interest rate (2-Week Repo) by MORE than (-) 25 basis points, Draghi replied, simply ...
... "No"
And, when asked if the decision to cut rates was unanimous, he replied ...
.... "No".
In other words ... dissent on the ECB ... skewed towards NO cut in rates.
In fact, I watched the press conference, live, and witnessed Draghi's 'affect', and heard his exact words. Simply stated, the ECB President was smooth and matter-of-a-fact, in his delivery, with the stone-cold persona of an old-school, Generation Europe, Central Banker ...
... "No monetary finance of governments."
Repeatedly, Draghi stated that "the treaty" (referring to the Maastricht Treaty on European Union) represents a 'legal contract', which implicitly and specifically PROHIBITS the "monetary finance of governments".
Draghi threw the crisis right back into the laps of the politicians, calling for a "new contract", one which implements more stringent "hard" limits on debts and deficits, with "harsh penalties" to be imposed on offenders.
Ahem, ummmmm, errrrrr ... don't they already have that ???
Of course they do. The Maastricht Treaty very specifically and consciously laid out "hard caps" on the total sovereign debt (60% of GDP) of individual member nations, and on the annual deficits (3% of GDP), with "harsh penalties" to be imposed on offending nations.
Indeed, 25 of 27 EU-member nations, including Germany, are currently in violation of Maastricht Treaty 'hard caps' on debt, deficits, or both, in a situation that has evolved over YEARS of non-compliance ...
... and not a SINGLE PENALTY has ever been imposed.
This Treaty is already ... worthless.
Thinking a new treaty will provide a solution to the CURRENT and IMMEDIATE crisis involving the need for governments (and banks) to meet refunding requirements estimated at near $2 trillion in the next 13 months ...
... does NOT 'compute', time wise.
Sure, a "new contract" might be the answer ...
... for the "Next Generation Europe".
And, yes, a "new contract" might 'allow', and thus facilitate, Central Bank debt monetization, as a support mechanism to help offset the natural deflationary impact yet to be generated via intensified fiscal austerity.
But politically speaking, in terms of the need for ratification by EVERY member nation, and a tectonic shift in the German political stance ...
... let alone the potential for public debate ...
... a "new contract" will take a LONG TIME to 'execute'.
TOO LONG, to be looked at as a solution.
The ECB just SLAMMED the door SHUT on a monetary solution ...
... and, threw the ball into the court of "lawyers", in terms of Draghi's repeated mention that implementing ANY debt monetization, whether direct via the ECB, or through the back-door, via member nation Central Banks, borrowing from the IMF. The ECB is implicitly opposed to such a move.
Indeed, if the EU were to pursue a back-door Central Bank solution, the US would be on the 'hook' for $135 billion of the (proposed) $750 billion support package.
Frankly, with its own MASSIVE debt refunding requirement exposure in the next 13 months, the US is NOT, fiscally, in a position to spend $135 billion to bailout fiscally irresponsible European nations.
Thus, the BIG problem with an optimistic vision.
Everyone is in the same boat, debt and deficit wise.
NO ONE single country, not even China ... can bail out EVERYONE.
Something's got to give.
VOILA ... pressure is on the build, as evidenced by the mathematics linked to the updated data offered by the ECB on Tuesday, in the form of their Balance Sheet.
We note the rise in Total Assets to a new record high. Evidence the chart on display below, which speaks for itself with the ECB's Total Assets headed towards EUR 2.5 trillion ... most of which represents intensified distress in the financial sector, via increased borrowing from the Central Bank, bond purchases by the ECB, and the back-handed 'sterilization' of those purchases, which results in higher Deposits.

The expansion in the ECB's Balance Sheet has been significant over the last six-months, pegged in the chart below at more than EUR a half-trillion.

Stress on the rise is evidenced by ...
... the rise in ECB Loans to European Credit Institutions.
We spotlight the chart on display below plotting the ECB's Balance Sheet entry for Loans Outstanding to European Credit Institutions (ie: banks), with focus on the recent renewed surge to more than EUR 600 billion in the latest reporting week. We observe that previous periods when the total exceeded EUR 600 billion, can be associated with times when macro-market turbulence is also 'on the rise'.
In that vein, we note the (previous) violation of, and more recent upside directional reversal by ... the long-term 2-Year Moving Average.

Similarly, we focus attention on the chart below plotting the ECB Balance Sheet entry for their Main Refinance Operations ...
... revealing an upside breakout, a sharp rise ...
... and ... a push to the highest level since 2009, at more than EUR 250 billion, a level that has, in the past, been associated with periods of heightened anxiety, as it relates to the 'health' of the EU banking system, and by extension, the EUR.

As per the data released on Wednesday, once again, as expected, the ECB drained liquidity from the banking system, to the same degree that liquidity was added by ECB purchases of sovereign debt ... thus, continuing their program of 'sterilizing', or neutralizing, the monetary policy impact of open market bond buying.
In the week-ended-Dec-6th, the ECB received bids for EUR 246.34 billion in 7-Day Deposits, and 'allotted' EUR 207 billion at a Weighted Average Allotment Rate of 0.65% (Marginal Rate of 1%) ... for a bid-to-cover of 1.19%, thus allowing the ECB to 'meet' that week's 'sterilization requirement'.
Such was NOT the case last week, when demand for Deposits was insufficient to 'meet' the ECB's needs, as evidenced in the chart below (courtesy of Tyler Durden, and zerohedge.com), plotting the amount that the ECB needs to sterilize on a weekly basis (blue line), versus the amount that banks bid for each week (red line). We focus on last week's 'failed' auction, which, if repeated, would represent UN-STERILIZED intervention, even if (allegedly) unintentional.

Subsequently, Deposits at the ECB have soared again, expanding to more than EUR 300 billion for the first time since the middle of last year, reflective of the 'sterilization', and indicative of the intensified stress in the banking system.

Emerging from the maze that is the ECB's Balance Sheet, and bond buying policy protocol, we note intriguing commentary from Miguel Carrion Alvarez of eurointelligence.com ...
... "There's no way that the ECB bond purchases can be inflationary, quite the contrary. In effect, the ECB is taking money from the private banks with one hand in order to buy bonds off them with the other.
Since these bonds are already eligible collateral for the weekly ECB refinancing operations, buying the bonds has nearly no monetary impact, so coupled with the weekly deposit-taking the net effect is contractionary.
It is even possible that the same banks are selling bonds to the ECB and putting the proceeds in ECB deposits, which would imply that the ECB is paying the private banks a premium for the privilege of storing their sovereign bonds.
Given that the ECB is paying up to 1% for the offsetting deposits instead of charging 1% in its refinance operations, each failure of sterilization indicates that the ECB was trying to drain more than the entire spare liquidity of the private banking system for one-week lending. That this spare liquidity is less than €80bn should give the inflation hawks pause." ---
There may be the appearance of a liquidity flood ...
... but there is no doubt about the macro-economic drought !!!
For sure, the inflation hawks must take pause nearly every time macro-economic data is released in the EU.
This is particularly true when it applies to data from Italy. We note yesterday's release of October's Industrial Production data, revealing a second consecutive monthly decline, and the fifth decline in the last six months. Industrial Output contracted by (-) 0.9% for the month, driving the year-over-year rate-of-change DEEPER into NEGATIVE territory ... pegged at (-) 4.2% ... down from (-) 2.7% yr-yr in September ... and a complete reversal from the +4.7% yr-yr growth rate seen in August.
Evidence the chart on display below revealing the worst performance since 2009, a downside violation of the 2-Year Moving Average, and the downside reversal, directionally, by the Average.

Digging deeper into the data, we can deduce that the decline in Italian Industrial Production was BROAD based, by sector. Evidence the data details on display below, defined by October's year-over-year change:
- Consumer Goods ... down (-) 5.3%
- Durable Goods ... down (-) 8.1%
- Non-Durables ... down (-) 4.7%
- Capital Goods ... down (-) 2.9%
- Intermediate Goods ... down (-) 3.8%
- Energy ... down (-) 5.3%
- Food ... down (-) 5.4%
Breaking it down even further, we note the following data dissected by 'product', and exhibiting both the monthly change, and the year-year rate:
- Wood, Paper, Print ... down (-) 1.8% month ... down (-) 7.5% yr-yr
- Coke, Refined Oil ... down (-) 3.5% month ... down (-) 6.2% yr-yr
- Chemicals ... down (-) 2.5% month ... down (-) 12.4% yr-yr
- Basic Metals ... down (-) 1.6% month ... down (-) 3.1% yr-yr
- Electrical Equipment ... down (-) 2.5% month ... down (-) 6.1% yr-yr
- Electricity-Gas ... down (-) 8.9% month ... down (-) 7.3% yr-yr
- Consumer Durables ... down (-) 3.0% month ... down (-) 8.1% yr-yr
Indeed, in the last two months alone, the year-over-year Rate-of-Change in total Italian Industrial Production has PLUNGED by a whopping (-) 8.9 percentage points ... representing the second LARGEST EVER back-to-back monthly DECLINE in the 12-month rate of change, behind only the back-to-back erosion posted at the height of the 2008-09 crisis ...
... as evidenced in the chart on display below.

Also, as we have previously discussed ... the EU debt-deficit-debacle has not only begun to mutate, into an EU credit crunch (as evidenced by the contraction in loans to households, and the bank funding fiasco) ... and ... has backfired into the global economy, via lower domestic EU final demand.
We have already dissected the Chinese trade data for October, but a replay is in order ... as implied by the DRAMATIC picture presented in the chart below, in which we plot the back-to-back net change, in USD, in China's monthly Exports to Italy.
In short ... the decline in September-October, pegged at (-) $817.94 million 'per month' in Exports from China to Italy, is THE LARGEST EVER back-to-back monthly declines that were not linked to the Jan-Feb Lunar New Year Holiday in China ... EASILY exceeding the largest ever two-month decline, posted during the 2008-09 global crisis, in September-October 2008.

But there is NO relief to be gleaned from the deflationary macro-environment, as it relates to the Italian Bond market, where yields are once again SOARING, on the back of bitter disappointment linked to today's ECB meeting, and the lack of new bond buying initiatives. Note the chart below revealing that the Fed Swap bombshell impact on the Italian Bond market (ie: lower yields) failed to even amount to a 38% Fibonacci retracement relative to the entire crisis induced rise.
It's STILL ... 'game on', in the Italian debt market.

And thus, it is STILL 'game on' in the Italian stock market, with downside pressure remaining the dominant force, as evidenced by today's deep post-ECB meeting decline of more than (-) 4%.
Once again we spotlight the chart below plotting the Italian MIB stock index, revealing that the recent rally has now, twice, been soundly rejected at overhead resistance marked by the med-term trend defining 100-Day Exponential Moving Average, in line with last month's rally to the 38% Fibonacci retracement level, relative to the decline since last September.
Clearly, a move below 13,920 would be MOST negative, technically, and would open the door for a serious test of the 1Q-2009 secular low.

More broadly, we note the chart below plotting the back-to-back monthly net change, in USD, in Chinese Exports to the European Union ... which plunged by $2.873 billion, or (-) 9.1%, in October alone.
We note that during the Sept-Oct two-month period, Chinese Exports to the EU plummeted by nearly (-) $5.5 billion, PER MONTH, for a nominal contraction of (-) 15.9%. This decline, as noted in the chart, represents the LARGEST EVER two-month contraction in Chinese Export to the EU, excluding the normal, seasonal decline posted every year in Jan-Feb, in conjunction with China's Lunar New Year holiday.

We can identify the same macro-trade-dynamic on the European side of the equation, as evidenced in the French trade data for October, published yesterday morning.
In fact, as evidenced in the chart below, the French Trade Deficit actually narrowed slightly for the month, albeit minimally, on the back of LOWER IMPORT DEMAND, as per a (-) EUR 129 million monthly decline.
Still, France's Trade Deficit of (-) EUR 6.248 billion is HUGE, with seven out of the last ten months producing a deficit in excess of (-) EUR 6 billion. We also observe the trajectory of the secular trend defining 5-Year Average, which reached a NEW ALL-TIME LOW in the most recent month.
Indeed, the current circumstance looks demonstrably WORSE than in 2008.

French markets remain at risk, case closed.
We note the 5-Year Sovereign Credit Default Swap Rate, seen in the daily chart on display below, with focus on the most recent decline, which maps out a text-book 'corrective' move, as per support defined by yesterday's low, and the technical convergence of the med-term 100-Day EXP-MA, and the 38% Fibonacci retracement level relative to the rise since the April low.

Similarly, while the decline in French Bond Yields has been dramatic ...
... it has remained within the context of a 'correction' in an ongoing bond bear market (higher yields), as per the recent low at 2.01%, which held the decline at the 61% Fibonacci retracement level relative to the entire 2011 expansion in yields.
Further, with today's post-ECB meeting spike back to the upside in French Bond yields, the yield on the 5-Year OAT has re-engaged the 100-Day and 200-Day EXP MA's in a way that implied intensified odds of a continued rise.
A move back above 2.32% opens the door, technically, for a run at the 2011 YTD high marked at 2.82%.

As for the French stock market (CAC-40 Index, as seen in the chart below), it looks eerily similar to the Italian market, in that the recent rally looks like nothing more powerful than a normal corrective recovery, in an ongoing bear market.
We focus on the rejection of the rally in the zone between the 38% and 50% Fibonacci retracement levels, and, the pair of rally rejections noted when the market 'touches' the med-term trend defining 100-Day EXP-MA.
Indeed, the med-term trend defining 100-Day EXP-MA remains bearishly tilted, in a downtrend ... as it has been ... ALL YEAR LONG !!!

The outcome of today's ECB meeting offers validation for our macro-thematic thought process, implying that the ECB is NOT going to be so willing to monetize debt ...
... and while that means the EUR is not under intense debasement pressure, the European currency is lower on the day.
Aside from the powerful macro-economic drought ... we note the influence on the currency to be garnered from the narrowing in the EU-US short-term interest rate differential, as evidenced in the chart shown below.
We shine the spotlight on the 3-Month Deposit Rate Spread, which, in anticipation of, and on the back of, today's rate cut, has extended its move towards a 'more narrow' EU short-term interest rate premium (green shaded, EU rate discount to the US is marked by the red shaded areas).

We have been, and are again, overly bearish on the Eurocurrency, particularly relative to the USD.
Evidence the chart below plotting the EU-US currency cross-rate (EUR-USD), revealing that the med-to-longer term picture defined by the moving average momentum and alignment, remains BEARISH, as it has been for the past couple of months. Clearly, a move below the dual-lows marked at 1.3211 and 1.3145 would be technically quite negative.
We expect such a move.

Similarly, we are once again overtly bearish on European stock indexes. '
We shine the spotlight on the price action in the futures contract linked to the Euro-STOXX 50 Index, seen in the chart below. Today's decline is threatening the near-term trend defining 50-Day EXP-MA, after already having violated the 100-Day EXP-MA earlier this morning. It takes a move above the high at 2404 to negate the renewed bearish technical evolution ..
.
... while a move below 2064 would be most negative, technically.

And finally, today's rejection by the ECB, and President Draghi, of ANY type of un-sterilized debt purchases and ANY shift towards the adoption of a 'true' quantitative easing campaign ... has HURT Gold.
We note the short-term intraday chart on display below plotting the price of Gold 'denominated' in EUR, revealing a mini-near-term breakdown, and the expanding risk of a more serious crack in the precious metal.
A move below 1276.1 euro-per-ounce, would be negative, technically.
We have exited our bullish Gold 'in' EUR campaign, and suggest that aggressive, short-term speculative types might consider a short position in USD-priced Gold, as a near-term trade.

"Generation Europe" might survive a decade.
But it is "Next Generation Europe" that is increasingly at risk.
As we have been repeatedly saying, for many months, and in fact, for the better part of two-years ... there will be NO 'easy', or 'quick' solution to the European debt-deficit-debacle.
A reworking of the Union Treaty would take TIME, something the individual governments, and the banks, do NOT possess.
Clearly, it will take MORE PAIN, to generate action significant enough to keep bond yields from rising, and the underlying economy from crashing.
We have used the comparison offered by the Greek Finance Minister early in 2010, when he compared the Greek fiscal situation to the Titanic. We went further, comparing the EU itself, to the Titanic ... a HUGE ship that few thought could ever 'float' in the first place, that is on the verge of SINKING.
