
A month has gone by since the last earnings report for Mid-America Apartment Communities, Inc. (MAA). Shares have added about 2.9% in that time frame, outperforming the market.
Will the recent positive trend continue leading up to the stock’s next earnings release, or is it due for a pullback? Before we dive into how investors and analysts have reacted as of late, let's take a quick look at the most recent earnings report in order to get a better handle on the important catalysts.
MAA's Q1 FFO and Revenues Beat Estimates, Revenues Up Y/Y
MAA reported first-quarter 2017 FFO of $1.46 per share, thus beating the Zacks Consensus Estimate by $0.02. However, the figure was down from $1.50 reported in the prior-year quarter.
The quarterly results reflected growth in same store property NOI and rise in average effective rent per unit for the same store portfolio.
Total operating revenue came in at $378.9 million in first-quarter 2017, exceeding the prior-year quarter figure by 40.8%. The Zacks Consensus estimate for revenues was $376.2 million.
Quarter in Detail
During the first quarter, adjusted same store NOI grew 3.6% compared with the same period in the prior year. This was the result of 2.8% growth in revenues and a 1.3% rise in operating expenses.
In the large market, 2.9% growth in revenues and a 0.3% increase in expenses resulted into a NOI increase of 4.5%. Again, in the secondary market, 2.4% rise in revenues and 4.4% growth in expenses led to 2.9% growth in NOI.
The quarter witnessed a 2.9% year-over-year rise in average effective rent per unit. Further during the quarter, the average physical occupancy for the same store portfolio was 96%, down from 96.1% in the prior-year quarter.
As of Mar 31, 2017, MAA held cash and cash equivalent of $34 million, up from $33.6 million as of Dec 31, 2016. Further, as of the same date, around $461.8 million of combined cash and capacity was available under its unsecured credit facility.
Post Properties Merger
For the merger with Post Properties, Inc., MAA incurred merger costs of $2.9 million or $0.02 per share in the reported quarter, which mainly comprised severance, legal, professional and advisory costs.
Other Portfolio Activities
During the quarter, the company acquired one property – a newly built 279-unit community, situated in Nashville, TN. As of Mar 31, 2017, MAA had seven development projects underway.
2017 Outlook
MAA expects 2017 FFO per share to be in the range of $5.74–$5.94.
For the second-quarter 2017, FFO per share is anticipated to be in the range of $1.36–$1.46 per share.
How Have Estimates Been Moving Since Then?
Following the release, investors have witnessed a downward trend in fresh estimates. There have been two downward revisions for the current quarter compared to one upward.
Mid-America Apartment Communities, Inc. Price and Consensus
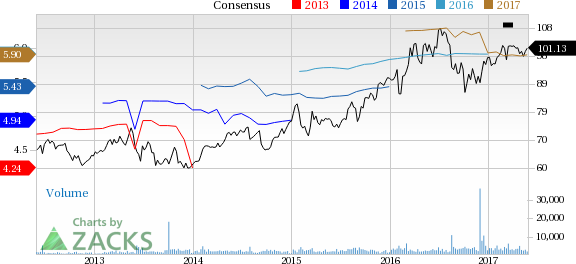
Mid-America Apartment Communities, Inc. Price and Consensus | Mid-America Apartment Communities, Inc. Quote
VGM Scores
At this time, MAA's stock has a subpar Growth Score of 'D', a grade with the same score on the momentum front. Following the exact same course, the stock was allocated also a grade of 'D' on the value side, putting it in the bottom 40% for this investment strategy.
Overall, the stock has an aggregate VGM Score of 'F'. If you aren't focused on one strategy, this score is the one you should be interested in.
Our style scores indicate investors will probably be better served looking elsewhere.
Outlook
Estimates have been broadly trending downward for the stock. The magnitude of these revisions also indicates a downward shift. Interestingly, the stock has a Zacks Rank #3 (Hold). We are expecting an inline return from stock in the next few months.
Mid-America Apartment Communities, Inc. (MAA): Free Stock Analysis Report
Original post
Zacks Investment Research