LPL Financial Holdings Inc. (NASDAQ:LPLA) released its monthly activity report for January 2018. The company recorded total brokerage and advisory assets of $636 billion at the end of the month, up 3.5% from the previous month. Of these, brokerage assets were $352.3 billion, while advisory assets were $284.2 billion, as of Jan 31, 2018.
Moreover, LPL Financial reported $28.7 billion of total client cash sweep balances for January, down 3.7% from December 2017. Of the total cash balance, $22.2 billion was insured cash, $4 billion was deposit cash, while the remaining $2.5 billion was money market cash balance.
With the gradual stabilization of global equity markets, trading activities are anticipated to improve. Also, LPL Financial has been extending its offerings to all affiliated advisors, which is expected to help the company gain greater market share. However, dismal top-line growth remains a major near-term concern.
LPL Financial currently sports a Zacks Rank #1 (Strong Buy). You can see the complete list of today’s Zacks #1 Rank stocks here.
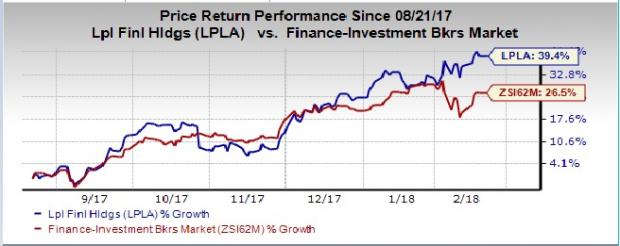
Investors’ optimism has been reflected in the share price movement. Shares of LPL Financial gained around 39.3% over the last six months as compared with 26.5% growth registered by the industry.

Performance of Other Investment Brokers
Interactive Brokers Group, Inc.’s (NASDAQ:IBKR) Electronic Brokerage segment reported a year-over-year increase in Daily Average Revenue Trades (DARTs) for January 2018. Total client DARTs came in at 903,000, surging 40% from January 2017 and 29% from December 2017.
E*TRADE (NASDAQ:ETFC) reported a rise in DARTs for January 2018. According to its monthly market activity, the company’s DARTs came in at 315,572, up 29% from the prior month and 57% year over year. Notably, derivatives comprised 30% of DARTs in January.
The Charles Schwab Corporation’s (NYSE:SCHW) monthly activity report for January 2018 shows an improvement from the year-ago period. Total client assets were $3.5 trillion at the end of the month, jumping 23% year over year.
Today's Stocks from Zacks' Hottest Strategies
It's hard to believe, even for us at Zacks. But while the market gained +18.8% from 2016 - Q1 2017, our top stock-picking screens have returned +157.0%, +128.0%, +97.8%, +94.7%, and +90.2% respectively.
And this outperformance has not just been a recent phenomenon. Over the years it has been remarkably consistent. From 2000 - Q1 2017, the composite yearly average gain for these strategies has beaten the market more than 11X over. Maybe even more remarkable is the fact that we're willing to share their latest stocks with you without cost or obligation.
See Them Free>>
E*TRADE Financial Corporation (ETFC): Free Stock Analysis Report
The Charles Schwab Corporation (SCHW): Free Stock Analysis Report
Interactive Brokers Group, Inc. (IBKR): Free Stock Analysis Report
LPL Financial Holdings Inc. (LPLA): Free Stock Analysis Report
Original post
