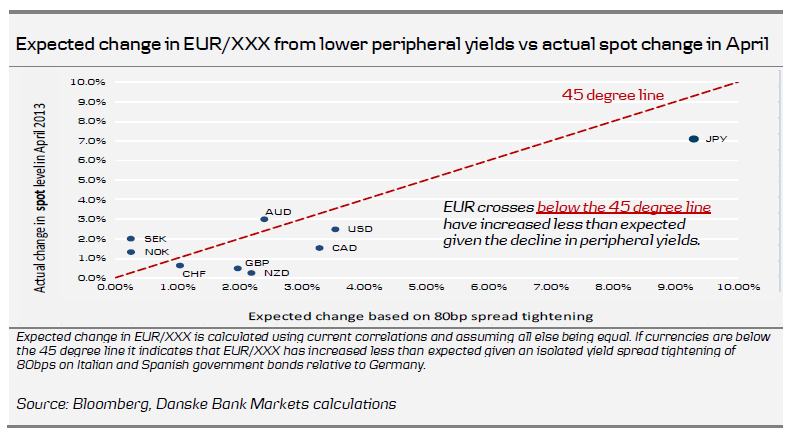
10Y Italian and Spanish sovereign bond spread to Germany, narrowed by about 80bp in April, and are now at the lowest levels since 2011. However, most EUR crosses are currently trading below the estimates of our short-term financial models, as many of the crosses have actually increased less than expected, given the decline in peripheral yields. According to our models, the lower peripheral yields point towards further EUR strength.

What stands out
The chart above shows the expected increase in spot given an 80bp yield spread tightening in Italy and Spain government bonds relative to Germany versus the actual change in spot levels during April. Most EUR crosses have actually increased less than expected given the decline in peripheral yields. According to our models, the lower peripheral yields point towards further EUR strength.
Looking at the signals from our short-term financial models, we currently observe the biggest misalignments in AUD/CAD, which trades 2.2 standard deviations below our models’ estimate. While the AUD has suffered, the NZD has performed relatively well over the past month and has reached overbought territory with the NZD/USD, trading 1.4 standard deviations above. The AUD/NZD is trading 1.6 standard deviations below the models’ estimate. After a more than 2% decline over the past week, the USD/CAD also looks increasingly oversold according to our models.
While our short-term models currently indicate that CAD and NZD are rallying and the AUD sell-off looks increasingly stretched, pricing does not look particularly stretched from a technical point of view. The AUD/NZD RSI level has dropped below 30, which is normally an indication that the risk of a near-term correction has increased. Given that the cross is still in a down trend according to ‘DMI analysis’, we prefer to look for better entry levels before considering the addition of long AUD/NZD spot positions.
Implied FX volatility has, in general, traded lower over the past couple of weeks and when evaluated by the historical differences between implied and realised volatility, we find that the 3M tenor looks cheap at present. When adjusted for volatility, risk reversals in all examined crosses trade within two standard deviations of their historical averages. The most extreme skews are generally seen in JPY and TRY crosses, with TRY/JPY as the most expensive.
To Read the Entire Report Please Click on the pdf File Below.
