A much lower than expected Australian 3Q GDP sends the AUD lower across the board.
Australian Q3 GDP fell by a much lower -0.5%q/q today against a consensus forecast of -0.1%. Household spending has failed to recover from a lacklustre Q2, and across other sectors, house construction, CapEx and government spending were all weak. Although trade (read mining), was weak at -0.2% there is some hope for a better Q4 at least from this sector as commodity prices continue to rise. Overall then a much worse performance than even the most pessimistic anticipated. With the Australian Government looking over its shoulder at the upcoming S&P credit review and maintaining its coveted Triple-A rating, no much help can be expected on the fiscal front.
The effect on AUD/USD was unsurprising, falling from the day’s highs at 7480 to a low of 7415 before a tepid bounce to 7430 where we have spent the rest of the day. Short term support is at 7412 on the hourly chart followed by 7370.
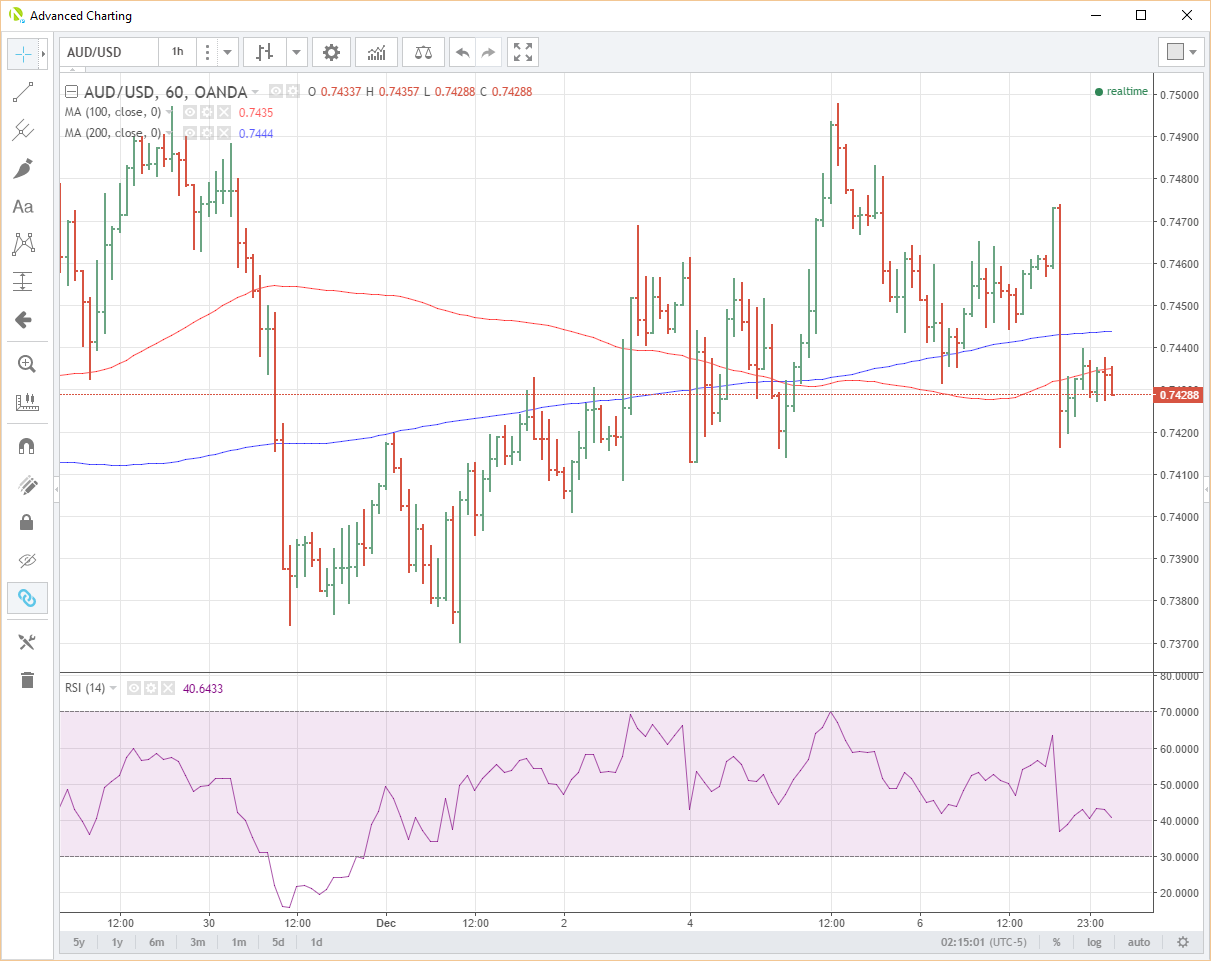
AUD Hourly
The daily chart isn’t looking much better with the failure at 7480 reinforcing a strong resistance line at 7500, multiple daily highs now. Support like the hourly sits at 7412 ascending wedge and then 7370 and 7310.
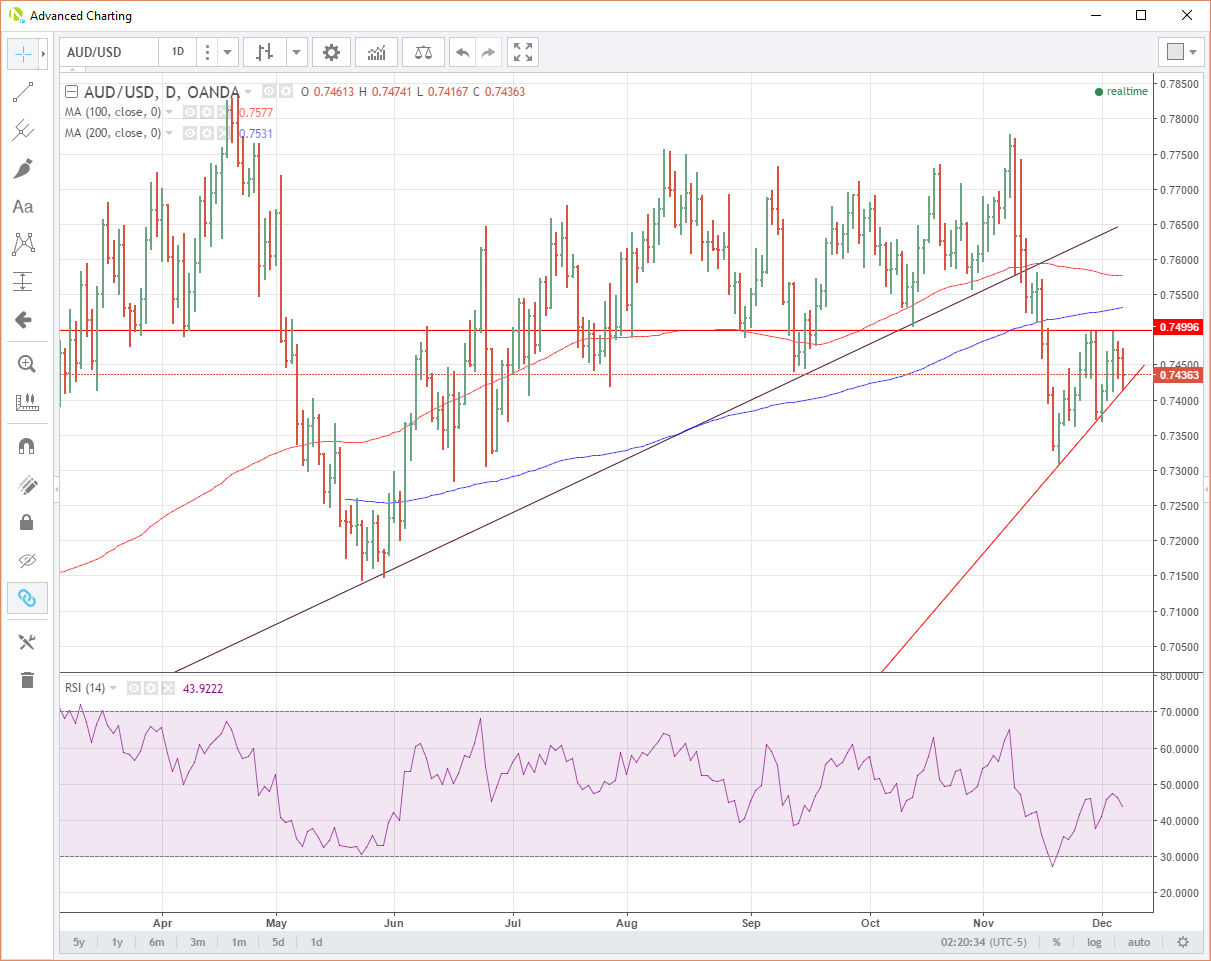
AUD/USD Daily
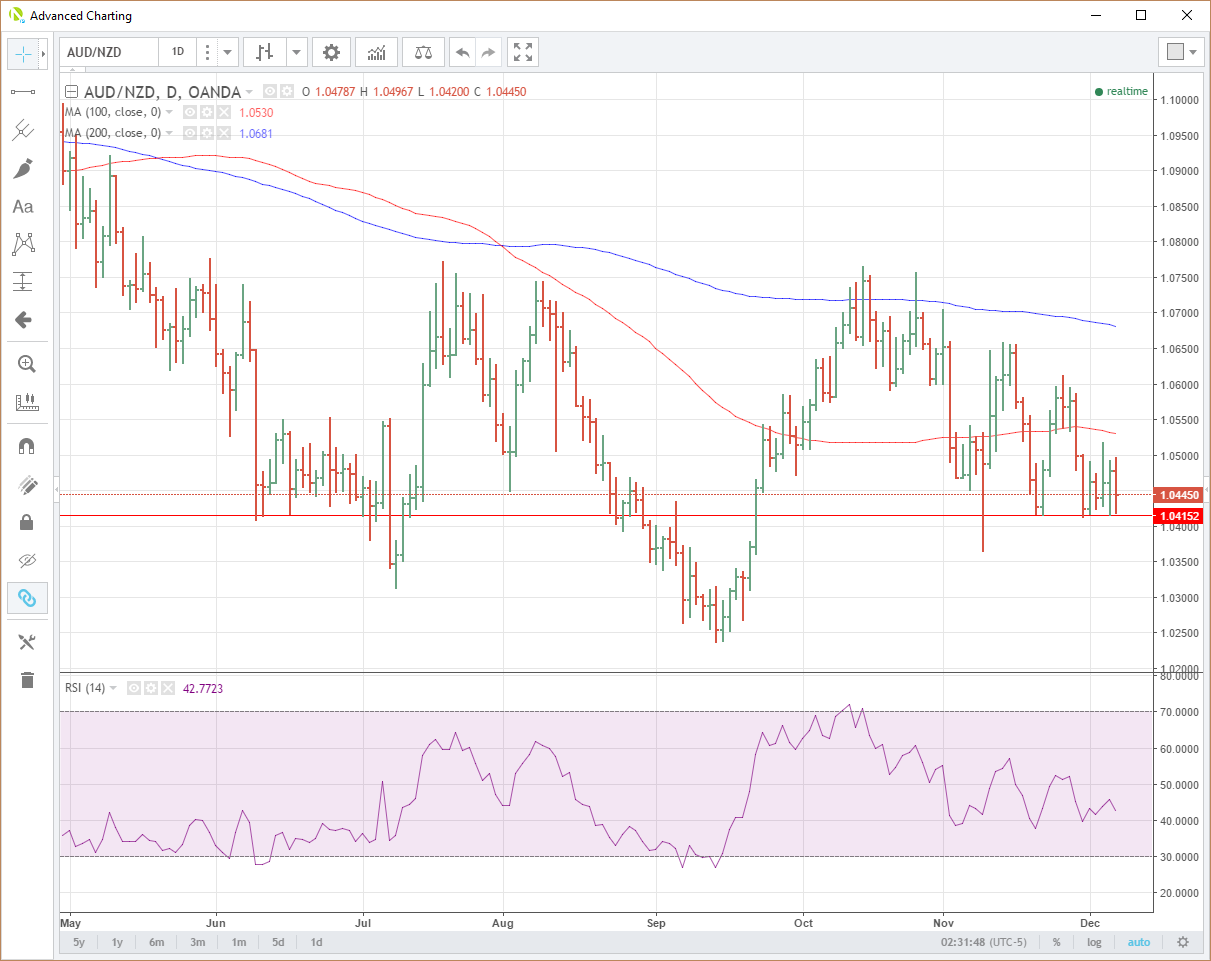
AUD/NZD fell to 1.0415 before climbing to 1.0445 as Europe opens. The NZD is generally on the front foot at the moment anyway post a strong Global Dairy Auction last night and upgrades to Fonterra’s milk payout forecast.
The daily chart shows strong support now at the 1.0410/15 area which held again this morning. However a daily close below suggests that 1.0350 is possible before the June lows around 1.0240. Resistance sits at the 1.0500 level, 1.0520 and then 1.0530 the 100-day moving average.
GBP/AUD is now consolidating comfortably above its 100-day moving average at 1.6883 with today move helping that cause. Resistance lies at 1.7150 and the 1.7790. Could GBP/AUD be a predictor of further upside for GBP?
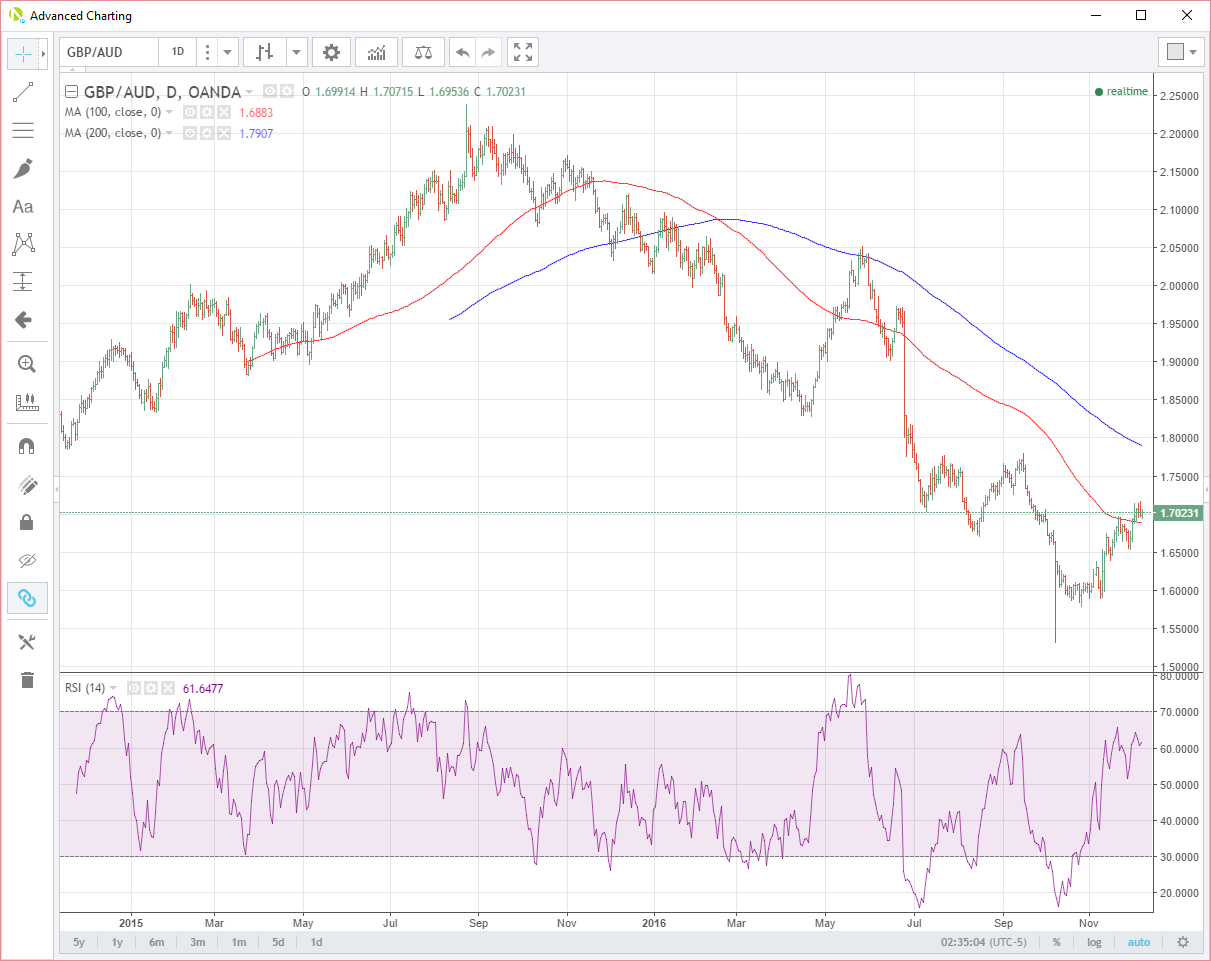
GBPAUDDaily
AUD/CAD, a very interesting chart. Is oil about to go higher? AUD is flirting with major support now in AUD/CAD. 9850 is a triple daily bottom and the 200-day moving average. A close below here would be technically significant indeed. Resistance above is at 9940.
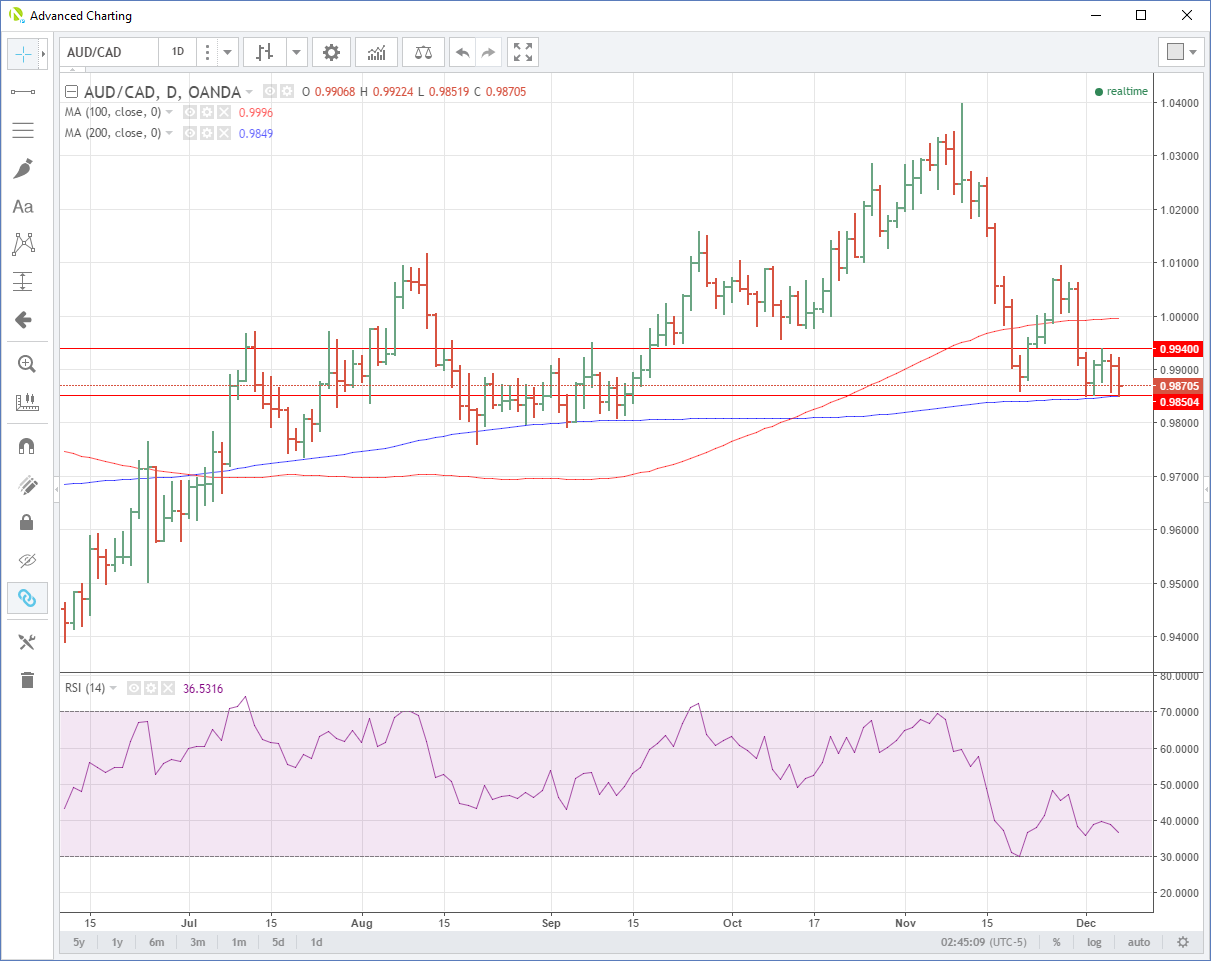
AUD/CAD Daily
XAU/AUD shows it’s not all bad, though. Or maybe it’s a case of the ugliest horse in the glue factory? Or maybe that XAU/USD has more downside yet to come. Either way though against the AUD, gold remains very much marooned in its down-channel.
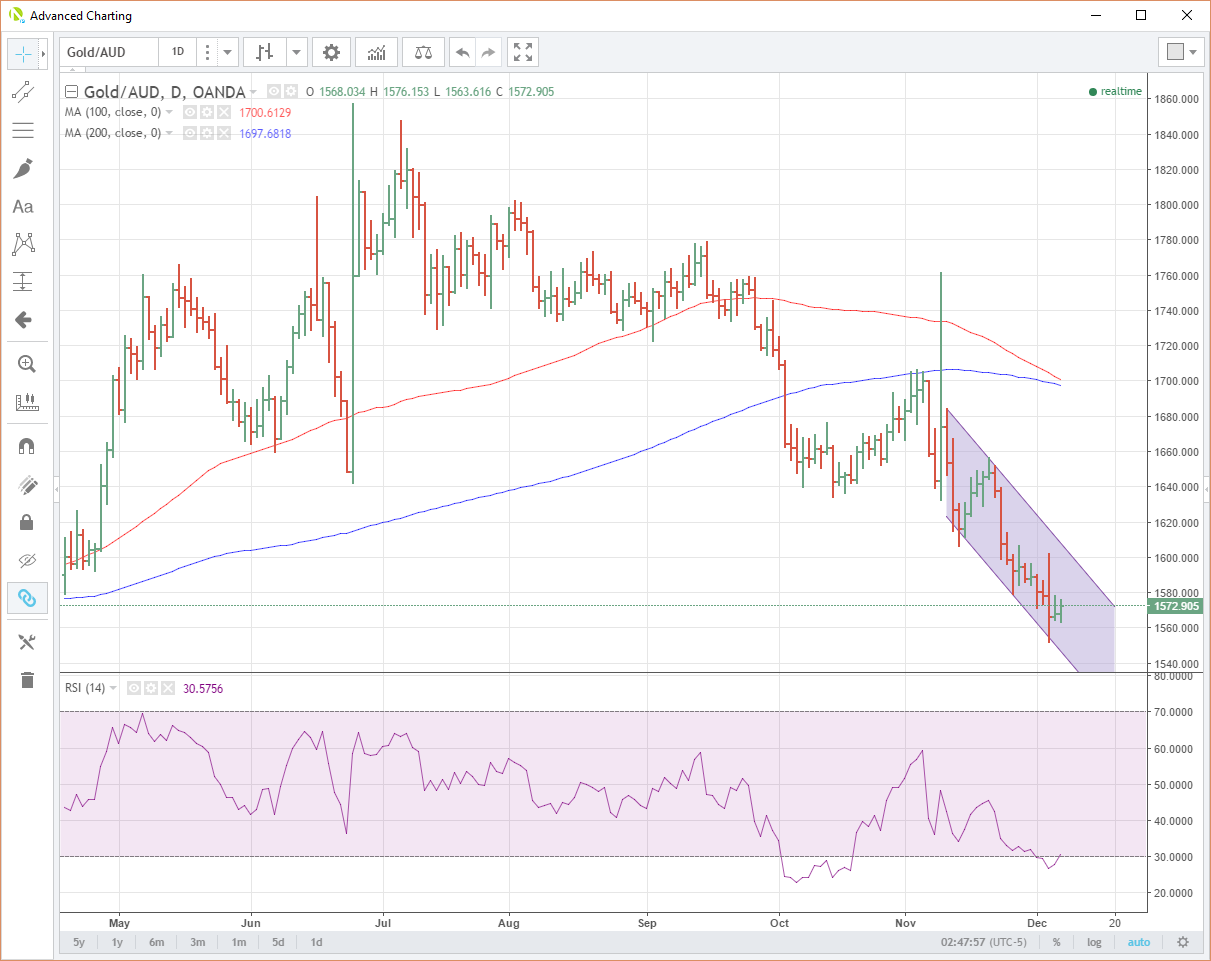
GOLD/AUD Daily
Today’s GDP was to speak Australian for a moment, “a shocker.” It should keep the RBA’s easing bias on the table into Q1 of 2017. With a poor Q4 print almost guaranteeing it. The government has little room to manoeuvre fiscally at the moment and thus the weight of effort must fall to Australian households themselves and the RBA.
Meanwhile, the AUD charts themselves may well be giving the street a clue as to the near term direction of various currencies, commodities and precious metals.
