
Many value-oriented stock pickers do not see a self-sustaining U.S. economy and they continue to play “Taps” on their trumpets. Commonly cited warning signs include: (1) The 10-year annualized price-to-earnings (P/E) ratio of U.S. stocks is above 25, (2) In absolute dollar terms, the amount of borrowed money (i.e. margin debt) in the stock market has never been higher, and (3) Corporations bought back stock with debt that they’ve already refinanced at ultra-low interest rates, and now they are hoarding cash rather than spending it on equipment, innovation or human resources.
For fundamental and technical reasons, I have been shifting a modest amount of client assets into foreign ETFs with verifiable uptrends. That said, I cannot help but notice that many of the same U.S. biases remain intact. Specifically, here in early January, investors are still bidding up the prices of 2013’s domestic ETFs winners rather than opt for underappreciated assets that may represent overseas opportunities.
So far, it does not seem to matter that SPDR S&P China’s (GXC) Forward P/E of 10.2 makes it nearly 40% “cheaper” than the S&P 500 SPDR Trust (SPY) and its Forward P/E of 16.7. Even if emerging markets are frightening, developed regional markets also boast significant P/E discounts. On a trailing 12 month basis, iShares MSCI EAFE Small Cap (SCZ) is 25% less expensive than the iShares Russell 2000 U.S. Small Cap Fund (IWM).
Certainly, one would think that a shifting of the tides is inevitable. Optimistically, one would have to anticipate that domestic stock ETFs slow down relative to price gains for foreign stock ETFs. Pessimistically, a bear might maul equities of all stripes, failing to provide shelter for those who chose to sift through the bargain bin.
So how might you protect yourself? For starters, you must recognize that cheap can always get cheaper. You could have purchased the Nasdaq 100 (QQQ) 60% off of its 120 high at a price point of 50 in 2001, yet that would not have prevented further downside of another 60% as QQQ dropped from 50 to 19 over the remainder of the 2000-2002 bear. Stop-limit loss orders can help one minimize the possibility of cheap turning into a disaster. Similarly, resolving to purchase assets that have established intermediate-term (100-day) and/or long-term (200-day) technical uptrends also increases the probability that you are making a well-reasoned decision.
For instance, Market Vectors Africa (AFK) has a trailing 12-month P/E of 12. Is it a bargain? Is it less risky than the name itself might otherwise dictate? Perhaps. The current price is not far from where it was a year ago. The price is also above both its 100-day as well as its 200-day moving average. Moreover, the 100-day recently crossed above the 200-day, a phenomenon that many technical analysts believe to be quite bullish. On a P/E of 12 alone, I would not be inclined to consider this exchange-traded tracker. With its recent price movement, however, I’d have greater confidence in this fund’s capital appreciation potential. 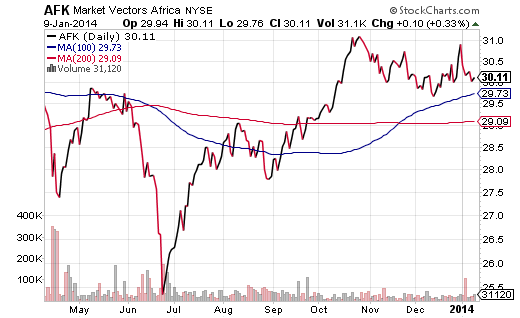
In contrast, a number of estimates place the Forward P/E for iShares MSCI Brazil (EWZ) at 11. That might be considered a steal at a 33% discount to the S&P 500. Yet from my vantage point, the recent inability of EWZ to hold either its long-term (200-day) trendline and/or its intermediate-term (100-day) trendline are reasons enough to look elsewhere. Efforts to catch a falling knife rarely pan out.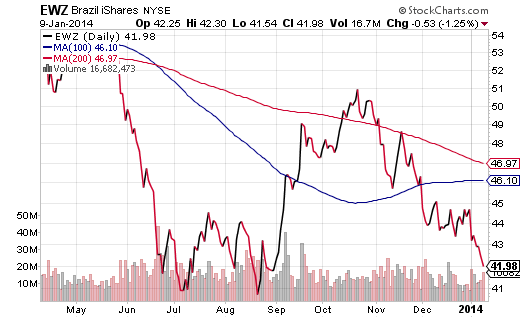
Disclosure: Gary Gordon, MS, CFP is the president of Pacific Park Financial, Inc., a Registered Investment Adviser with the SEC. Gary Gordon, Pacific Park Financial, Inc, and/or its clients may hold positions in the ETFs, mutual funds, and/or any investment asset mentioned above. The commentary does not constitute individualized investment advice. The opinions offered herein are not personalized recommendations to buy, sell or hold securities. At times, issuers of exchange-traded products compensate Pacific Park Financial, Inc. or its subsidiaries for advertising at the ETF Expert web site. ETF Expert content is created independently of any advertising relationships.
- English (UK)
- English (India)
- English (Canada)
- English (Australia)
- English (South Africa)
- English (Philippines)
- English (Nigeria)
- Deutsch
- Español (España)
- Español (México)
- Français
- Italiano
- Nederlands
- Português (Portugal)
- Polski
- Português (Brasil)
- Русский
- Türkçe
- العربية
- Ελληνικά
- Svenska
- Suomi
- עברית
- 日本語
- 한국어
- 简体中文
- 繁體中文
- Bahasa Indonesia
- Bahasa Melayu
- ไทย
- Tiếng Việt
- हिंदी
Low P/E ETFs Less Risky With Technical Uptrends
Published 01/09/2014, 11:44 AM
Updated 03/09/2019, 08:30 AM
Low P/E ETFs Less Risky With Technical Uptrends
Latest comments
Loading next article…
Install Our App
Risk Disclosure: Trading in financial instruments and/or cryptocurrencies involves high risks including the risk of losing some, or all, of your investment amount, and may not be suitable for all investors. Prices of cryptocurrencies are extremely volatile and may be affected by external factors such as financial, regulatory or political events. Trading on margin increases the financial risks.
Before deciding to trade in financial instrument or cryptocurrencies you should be fully informed of the risks and costs associated with trading the financial markets, carefully consider your investment objectives, level of experience, and risk appetite, and seek professional advice where needed.
Fusion Media would like to remind you that the data contained in this website is not necessarily real-time nor accurate. The data and prices on the website are not necessarily provided by any market or exchange, but may be provided by market makers, and so prices may not be accurate and may differ from the actual price at any given market, meaning prices are indicative and not appropriate for trading purposes. Fusion Media and any provider of the data contained in this website will not accept liability for any loss or damage as a result of your trading, or your reliance on the information contained within this website.
It is prohibited to use, store, reproduce, display, modify, transmit or distribute the data contained in this website without the explicit prior written permission of Fusion Media and/or the data provider. All intellectual property rights are reserved by the providers and/or the exchange providing the data contained in this website.
Fusion Media may be compensated by the advertisers that appear on the website, based on your interaction with the advertisements or advertisers.
© 2007-2025 - Fusion Media Limited. All Rights Reserved.