Low & Bonar PLC (LON:LWB) announced a fully underwritten £54m placing and open offer (c £50m net) alongside FY18 results. The new equity funding goes a long way towards resolving balance sheet net debt constraints and allows the relatively new management team to execute its updated strategic plan. Our revised estimates incorporate the funding effects, more gradual EBIT margin recovery and reset dividends in line with the stated policy.
FY18 results reflect a challenging year
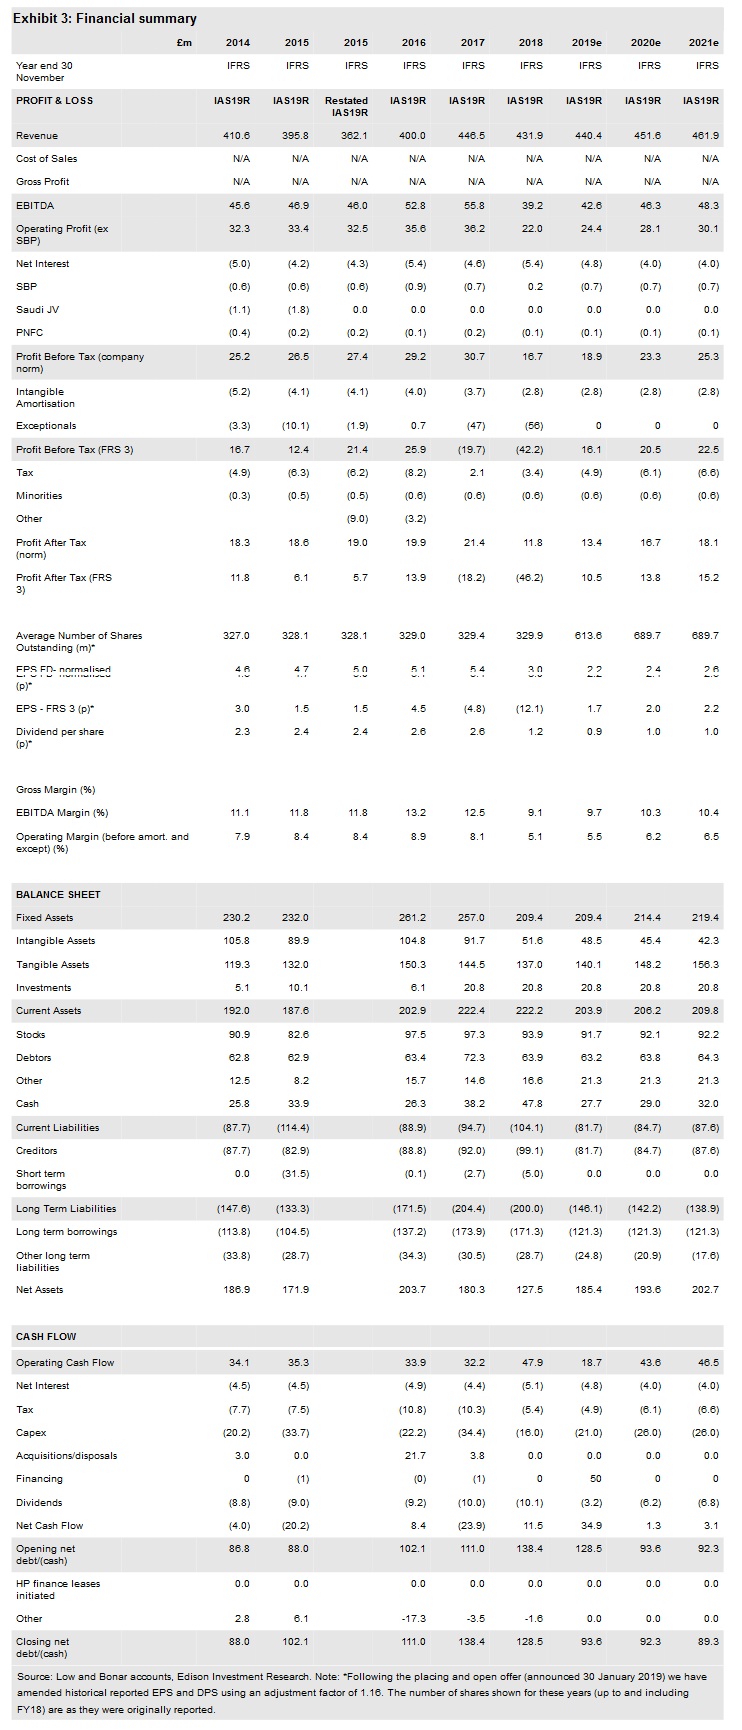
FY18 results themselves were broadly in line with our estimates – albeit with a lower final dividend – as was year-end net debt. Input price increases and production issues (in Building & Industrial and Coated Technical Textiles) were a drag on financial performance though the return to Civil Engineering profitability is a welcome development ahead of the intended disposal of that division. The final dividend was below our expectations but understandable given the requirement to raise fresh equity funding to repair the company’s balance sheet. For the record, net debt at the end of FY18 was £128.5m, c £10m lower than a year earlier.
Busy agenda for the new management team
Management actions to change the group structure and reduce costs were barely visible in the FY18 results but they should further benefit operating and financial performance. The re-financed balance sheet will support capex to upgrade core manufacturing operations and product innovation with the aim of growing ahead of GDP in the regions served. With a full agenda for the new senior management team, we have further trimmed our divisional margin estimates for FY19 and FY20 giving rise to 7–8% EBITDA reductions and adjusted for lower interest costs after the equity raise. Our estimates also reflect an increased number of shares in issue (+ c 360m to c 690m) and a re-set dividend cover policy of approximately 2.5x.
Valuation: Re-building earnings
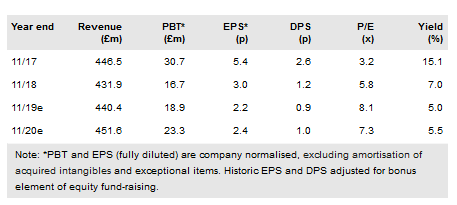
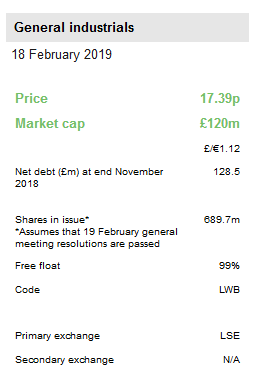
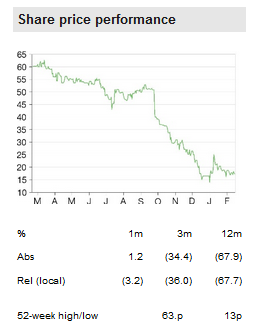
The announcement to raise new equity has brought some relative stability to Low & Bonar’s share price, which had tracked lower during 2018. On our revised estimates, which assume that the equity issue is approved by shareholders, the company’s EV remains below 0.5x revenue and sits at 5.5x FY19 EBITDA (adjusted for pensions cash); these multiples are comparable to the levels for FY18 in our December note. On a P/E basis, the FY19 multiple is 8.1x, and applying the restated dividend policy generates a 5.0% dividend yield at the current share price. We project an NAV of 27p for the end of FY19, with primary adjustments for the additional shares in issue and FY18 impairment charges compared to our last note.
FY18 results overview
On a like-for-like, constant currency basis, Low & Bonar increased revenue slightly in FY18, but a combination of market challenges and some internal process issues resulted in a significant drop in profitability. Despite this, improved working capital management enabled some reduction in net debt over the year. A post year end £50m equity fund-raising eases balance sheet constraints and should permit higher levels of investment in the core business. The dividend policy was also restated at this time; our revised estimates reflect this and a slower EBIT margin recovery than previously expected.
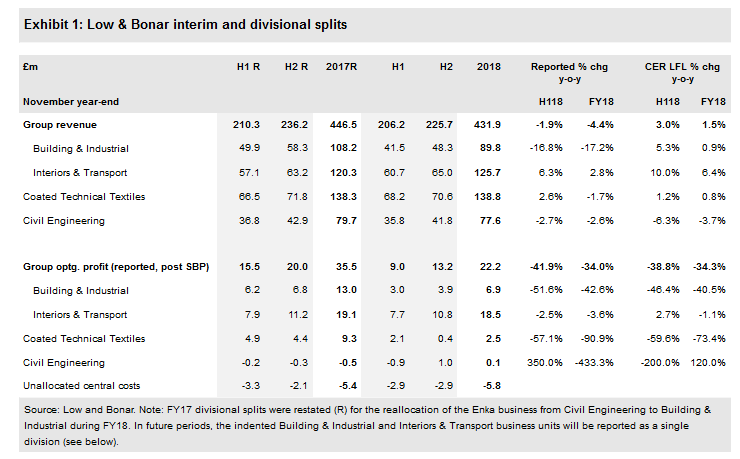
At the end of 2018, Low & Bonar established the Colbond division through the merger of its Building & Industrial and Interiors & Transportation divisions, which share common manufacturing processes. Aggregating the FY18 trading results for these businesses generates combined revenue and operating profit (before unallocated costs) of c £216m and £25.4m, respectively. The division is to be run on a three-region basis (Americas, EMEA and Asia-Pacific), replacing the previous global business unit (GBU) structure. The following sections discuss FY18 performance under the reported GBU structure.
Building & Industrial (B&I) – profit reduction due to markets and manufacturing
Technical textiles, mats, composites and systems for a range of applications
In underlying terms (ie adjusting for exited agro-textiles activities and FX), the B&I division achieved marginally better sales than the prior year but a significant reduction in profitability. Two of the three business segments in this GBU grew constant currency sales year-on-year – Building (+3.6%) and Industrial (+6.8%) – though we believe that the rate of progress was below that achieved in H1 in both cases. Nevertheless, this represented good progress, which was largely offset by an 11.4% revenue decline at Enka. Following the transfer of this business from the Civil Engineering business at the beginning of the year, integration issues were flagged, contributing to a 6.8% sales reduction in H1; this and some production disruption at Asheville, NC, appears to have coincided with a significant US customer completing an exclusivity agreement and may have contributed to an implied larger year-on-year revenue dip in H2.
Despite the Enka situation, competitive European roofing markets and restricted polymer price pass through success, B&I did deliver an improved operating margin in H2 (ie 8.1% versus 7.2% in H1), although it was 430bp lower for the year as a whole at 7.7%. Investment at Enka to improve plant and operational efficiency should improve performance and business mix as FY19 develops and a stable polymer pricing environment would facilitate better input cost recovery, we believe.
Interiors & Transportation (I&T) – market growth and investment
Leading provider of technical non-woven carpet-backing materials, branded as Colback
In underlying terms, with mid-single digit revenue growth and a broadly similar operating profit to the prior year, I&T was the best performing business unit in the group in FY18. We note that the rate of progress was somewhat slower in H2 however. Flooring is the largest segment addressed and with growth in all of the main regions served, underlying revenue rose by 8.7%. Increased capacity and volume from a new line in China was a significant contributor here, but there was also growth with key accounts elsewhere, notwithstanding competitive challenges. In contrast, in the automotive segment end-market demand mix in the US and cost pressures in Europe led to an underlying 5.7% revenue decline.
While the achieved FY18 operating margin did decline (by 120bp to 14.7%) we consider this to be a respectable performance in the light of polymer input cost pressures and adverse mix effects and still at a good level overall. Apart from the second Colback line at Changzhou we are not aware of any other structural business changes during the year. That said, the US production facility at Asheville, NC, has been earmarked for a capex programme (c £10m over the next three years) to increase operating efficiencies towards facilities with similar lines in Europe and China. While part of this relates to Enka (see B&I), other investment relates to carpet-backing products. Of course, I&T was combined with B&I to form Colbond at the beginning of FY19 and greater co-ordination between the regions in this way is a natural progression in our view. In outlook terms, management appears confident in growth prospects in I&T’s markets. The extent to which Low & Bonar can participate in this and also deliver increased profitability will partly depend upon improvements in production processes, we suspect.
Coated Technical Textiles (CTT) – addressing process challenges to improve efficiency
Specialist coated woven carrier fabrics for a range of primarily outdoor applications
CTT revenue was slightly higher in FY18 and, we believe, at a record level despite fire-related disruption at the division’s coating facility at Lomnice during H2. Given that volume and mix were both adverse influences on revenue progress, we conclude that the sale profile was characterised by shorter runs of higher-value/higher-material content lines relative to the prior year. No sector-specific splits were provided but an increased bias towards tarpaulins and sports/leisure applications (and a lower proportion of tensile architectural membranes) is consistent with this profile. There may also have been an element of inventory reduction supporting divisional revenues.
However, achieved profitability remained under pressure with a 490bp EBIT margin reduction (to 1.8%). Deteriorating like-for-like profitability as the year progressed was partly influenced by the Lomnice fire referenced above. Production inefficiencies during line changeovers has been highlighted previously by management but a root and branch process review has been undertaken, highlighting a number of inter-related process challenges. Under-investment appears to have been at the heart of these issues, which is being gradually rectified. Some product reformulation has been required and the associated re-certification process is expected to be complete by the end of H119. The objective is to become a more agile and efficient organisation in all respects and improve quality, reliability and service levels with customers. This will not be an overnight process but in setting a return to high-single-digit margins the direction of travel is clear. Reflecting recent performance, we note that the balance sheet goodwill associated with this division was fully impaired in FY18.
Civil Engineering (CE) – improving profitability ahead of divestment
Geotextiles and construction fibres contributing to groundworks integrity in infrastructure projects
The closure of the loss-making Ivanka plant (as reported in H1) accounted for slightly more than the headline revenue reduction in this division but also had a favourable impact on mix and profitability. For the ongoing businesses, needle-punched non-woven fabric/barrier material sales increased by 3.8%, while construction fibre cement additives declined by 6.9%, and we assume other non-woven/woven lines were somewhere in-between though this was not specified. Given a number of structural changes within this division, it is difficult to appraise the extent to which its competitive position has altered. We would expect that the business proposition is now a narrower, better-defined product offering backed by a more-focused salesforce and a more appropriate cost structure.
CE’s return to profitability in FY18 is a notable achievement; while full year EBIT was just £0.1m this included a £1m profit in H2, reversing a similar loss in H1. While there is some favourable seasonality here, we note that underlying revenues in H2 were broadly the same year-on-year but with a £1.3m improvement in H2 EBIT year-on-year giving a good indication that cost reduction actions taken by the new management team have been effective. We consider that the return to profitability together with reduced balance sheet pressure following the group equity raise should be helpful to Low & Bonar as a vendor of this business. Attributable net assets were c £19m at the end of FY18 and until any divestiture is announced, CE will continue to be included as a contributor to our group estimates.
Significant non-underlying items, mainly non-cash
For the FY18, Low & Bonar’s income statement included a £58.9m exceptional charge before tax for non-underlying items1 relating to continuing operations. We estimate that c £46m of the charge was non-cash; approaching half of the c £13m cash charge flowed out during FY18 and a further c £4m is included in our model for FY19.
The largest single item was the £39m full impairment of CTT goodwill and, together with some smaller items, the total for this business unit was £40.7m. Other charges were
£8.4m Central/unallocated, around half of which was restructuring and half for an additional pension funding liability.
£3.9m Civil engineering, mainly impairment of Hungarian plant and R&D costs
£1.7m Building & Industrial, largely relating to the agro textiles disposal
£1.1m Interiors & Transportation
Re-set capital structure following equity funding
At the end of November, group net debt stood at £128.5m, a decrease of c £10m y-o-y (after an adverse £1.1m FX translation effect).
Despite a c £16m y-o-y reduction in EBITDA, underlying operating cash flow – excluding pensions and exceptional cash movements - rose by over £20m to c £57m in FY18. This was driven by a significant swing in the net working capital (NWC) performance, generating an £18m inflow in the year (compared to a c £20m outflow in FY17). As previously noted, NWC absorption has been at relatively high levels in recent years – partly to support the development of new facilities – and management has acknowledged that it should be reduced. It is encouraging therefore that the full year inflow was larger than that reported at the interim stage. For the record, all three WC line items were positive; we believe that inventory reduction and improved debtor collection achievements are sustainable with further progress targeted, though this is likely to be more than offset by unwinding payables positions in the coming year (see below). Our analysis also deducts pension cash contributions (£3.4m) and outflows related to exceptional items (c £6m) to arrive at headline operating cash flow of c £48m for FY18.
The other notable feature of FY18 cash flow was the year-on-year reduction in capex; completion of the Chinese start up and expansion phase during the year saw capacity-related spend drop from c £23m in FY17 to c £8m in FY18. Spend on existing facilities was more stable at £7.1m (£6.5m in the prior year). The completion of Colbond’s ERP system development and implementation required £3.4m cash investment (down from £5m in FY17) and was largely matched by unrelated asset disposal proceeds.
After factoring in cash outflows for interest tax and dividends (collectively c £20m), Low & Bonar’s cash inflow before financing was just above £11m for the year. Greater focus on working capital and controlled ongoing capex levels delivered this positive but necessary cash improvement in the year. In noting that average net debt in FY18 was c £159m – versus c £138m at the beginning and c £128m at the end – management acknowledged that creditor stretch at period ends was the reason for this profile. Additionally, there has been under-investment in core business areas. For the record, banking facilities in place are c £216m.2
Cash flow outlook: The £50m net equity fund-raising re-sets the group capital structure and should permit the new senior management team to improve operational performance and pursue its growth target (ie delivering 1–2% above regionally weighted GDP). Several aspects including innovation and investment have multi-year time horizons, so a sharp, immediate recovery is not anticipated. Adjusting end FY18 net debt for the equity raise and a c £20m structural unwind of balance sheet payables gives a pro forma position of c £98m. Hence, our end-FY19 projection of £94m implies a small underlying net cash inflow for the company this year. Behind this there is an increase in profitability but also cash spend on exceptional items (c £4m) and a step up in capex (to c £21m), while the re-set dividend policy will reduce but not eliminate cash dividend payments. Beyond the current year, our estimates currently show a modest reduction in net debt, after factoring in sustained higher capex spending. At some point, CE disposal proceeds should contribute to lower debt levels also, but this is not currently in our forecasts. For future reference, the annual depreciation run rate for the group as it is now stands at £16–17m (of which just over £1m relates to CE).
Margin expectations trimmed and dividend policy re-set
Our c 2–3% annual headline revenue growth is consistent with a modest out-performance of a relatively low and slowing macroeconomic growth environment in the western hemisphere and Low & Bonar’s Chinese exposure is helpful in this regard. At the EBIT level, while we expect some catch up in passing through polymer input costs in FY19, rectifying some underperforming plants (particularly in B&I and CTT) cause us to trim operating margin expectations by c 60–70bp for both FY19 and FY20 against our previous estimates. Lower interest costs following the equity fund-raising partially offset the above effects at the pre-tax level.

Group dividend policy has been re-set to a 40% payout level of average earnings (or EPS dividend cover of 2.5x).
