Losses Still Weigh On Most U.S. Equity Sectors So Far In 2018

Published 04/27/2018, 06:33 AM
Updated 07/09/2023, 06:31 AM
SPY
-
XLY
-
XLE
-
XLP
-
XLK
-

Red ink continues to prevail for most US equity sectors for year-to-date (YTD) performances through Thursday’s close (April 26). Just four of the eleven sectors are currently posting gains this year, based on a set of ETFs.

The strongest YTD performer at the moment: consumer discretionary stocks. The Consumer Discretionary Select Sector SPDR (XLY) is up 5.3% this year. The gain represents the biggest sector premium over the broad market’s fractional 0.2% year-to-date return, based on the SPDR S&P 500 ETF SPY. Meanwhile, the Consumer Staples Select Sector SPDR Fund (XLP) is nursing the biggest YTD sector loss: the ETF is off nearly 11% so far in 2018.
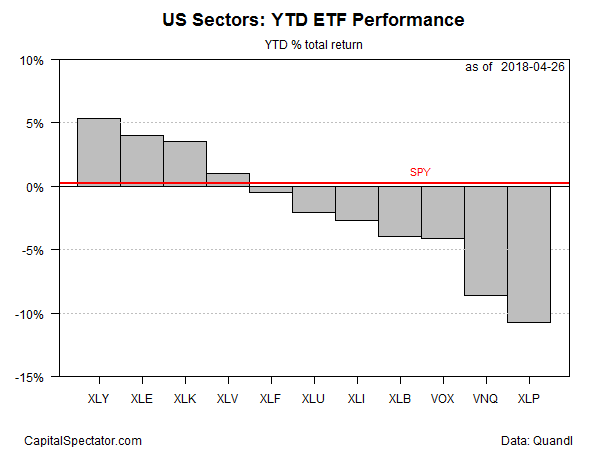
US Sectors: YTD ETF Performance Chart

For the one-year trend, tech remains the clear winner. The Technology Select Sector SPDR (XLK) is up a strong 24% over the past 12 months – well ahead of the rest of the field.

Paul Nolte, portfolio manager at Kingsview Asset Management, says:

Tech has been the leading sector of the market for years, and while it took a back seat over the past few weeks, it is now reasserting its leadership and the market is following.

While I’m not comfortable with market valuations overall, tech still looks relatively inexpensive.
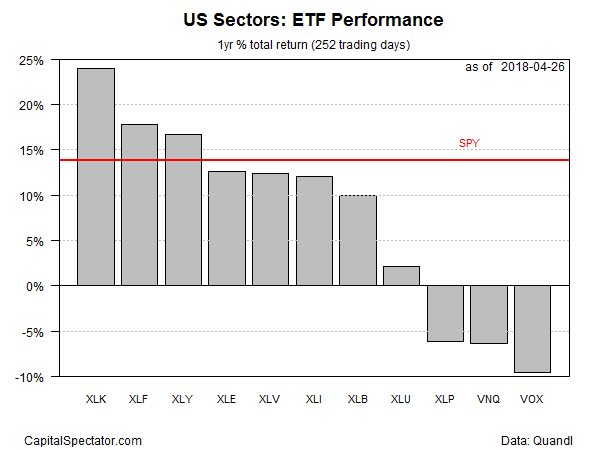
US Sectors: ETF Performance Chart

Tech’s dominance for the trailing one-year window remains conspicuous, as the performance chart below reminds. Although XLK has stumbled recently, the ETF is still firmly in the lead relative to year-earlier prices.
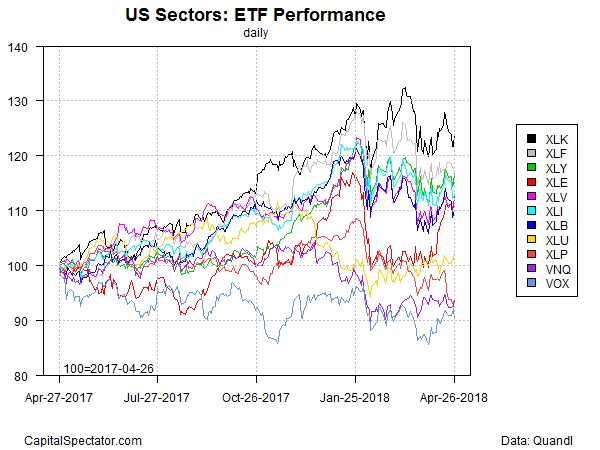
US Sectors: ETF Performance Chart

Ranking the sector ETFs by current price relative to 200-day moving average, however, reveals that energy stocks are posting the strongest momentum profile at the moment. The Energy Select Sector SPDR (XLE) closed yesterday at roughly 10% above its 50- and 200-day average – a bullish outlier vs. the other sector ETFs on this score.
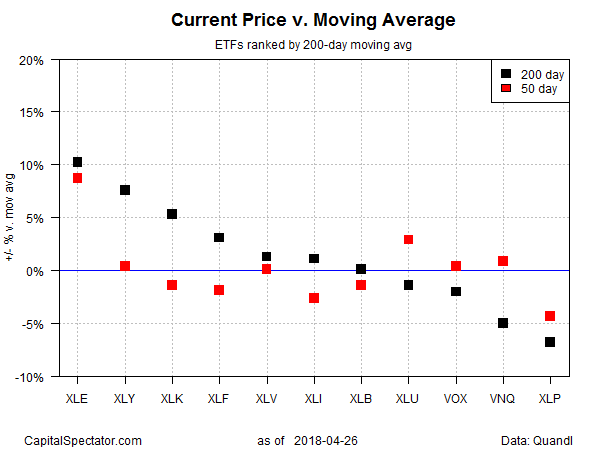
Current Price vs Moving Average

Ranking sector ETFs by current drawdown, on the other hand, reveals that the energy sector is still deep in the hole. XLE’s peak-to-trough decline is 20%-plus at the moment, substantially deeper compared with drawdowns in the other sectors.
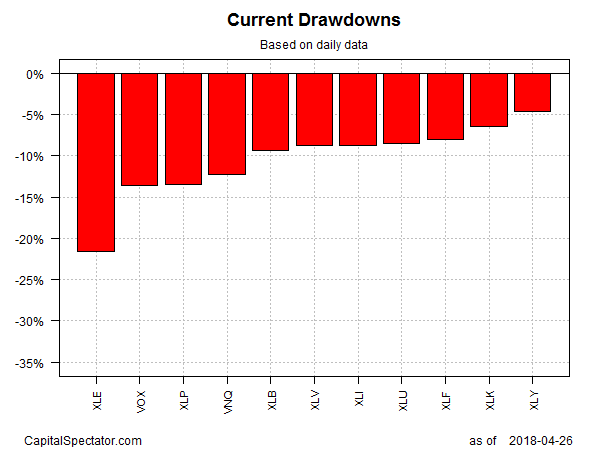
Current Drawdowns Chart

Latest comments

Loading next article…
Risk Disclosure: Trading in financial instruments and/or cryptocurrencies involves high risks including the risk of losing some, or all, of your investment amount, and may not be suitable for all investors. Prices of cryptocurrencies are extremely volatile and may be affected by external factors such as financial, regulatory or political events. Trading on margin increases the financial risks.
Before deciding to trade in financial instrument or cryptocurrencies you should be fully informed of the risks and costs associated with trading the financial markets, carefully consider your investment objectives, level of experience, and risk appetite, and seek professional advice where needed.
Fusion Media would like to remind you that the data contained in this website is not necessarily real-time nor accurate. The data and prices on the website are not necessarily provided by any market or exchange, but may be provided by market makers, and so prices may not be accurate and may differ from the actual price at any given market, meaning prices are indicative and not appropriate for trading purposes. Fusion Media and any provider of the data contained in this website will not accept liability for any loss or damage as a result of your trading, or your reliance on the information contained within this website.
It is prohibited to use, store, reproduce, display, modify, transmit or distribute the data contained in this website without the explicit prior written permission of Fusion Media and/or the data provider. All intellectual property rights are reserved by the providers and/or the exchange providing the data contained in this website.
Fusion Media may be compensated by the advertisers that appear on the website, based on your interaction with the advertisements or advertisers.
© 2007-2025 - Fusion Media Limited. All Rights Reserved.