Key Points:
- Leg four of the Elliot wave has reached a near-term hurdle.
- MACD and Parabolic SAR readings should see this obstacle overcome.
- Keep an eye on the Canadian economic news to avoid any surprise moves.
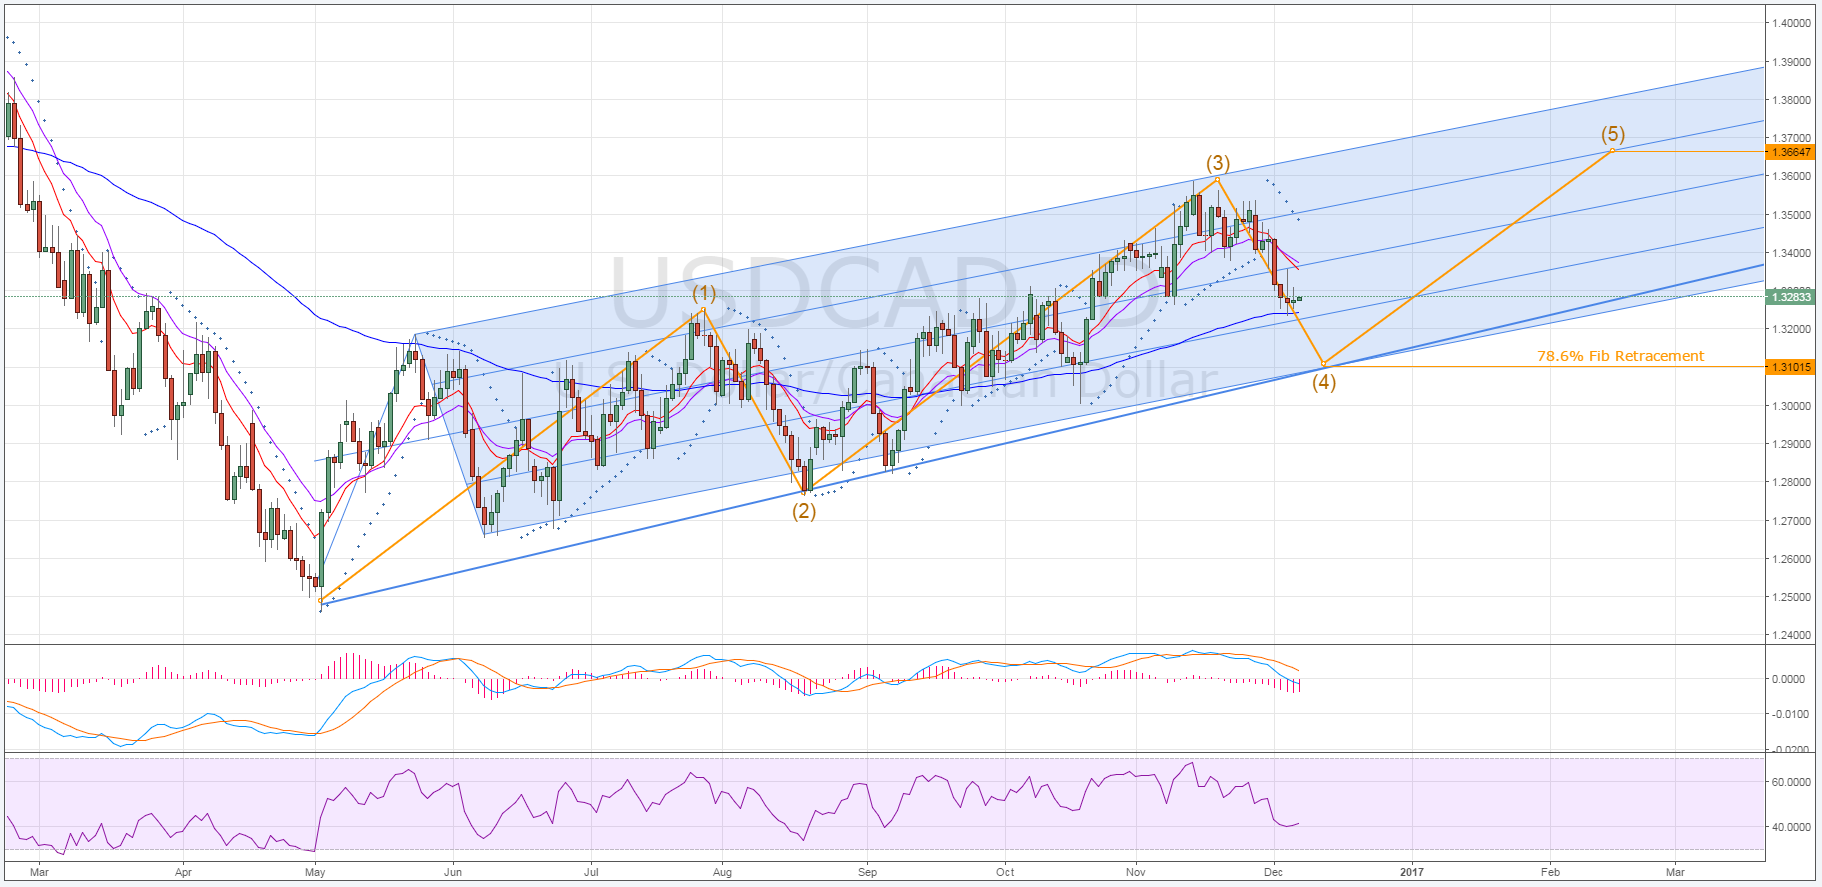
The long-term pattern that we have been tracking for the loonie has reached an impasse this week, the pair now halting its forecasted tumble as support begins to intensify. As a result, there are now two options available to the USD/CAD, one of which could drastically upset the long-term forecast for this pair. Consequently, it’s worth taking a closer look at some of the technical signals in order to clarify whether or not we can expect a final leg of an Elliot wave take place.
Whilst last week did see some doubts surface about whether the loonie could make the requisite tumble to keep the long-term Elliot wave valid, the slip in USD sentiment seems to have encouraged the appropriate retracements to take place. However, the USD/CAD still has one further hurdle to overcome if we are going to see leg four retrace in full. Specifically, we must see the current level of support breached and then the loonie must sink back to around the 1.3101 mark by mid-December.

This impasse could prove somewhat more difficult to resolve, relative to the last support that was broken as the fourth leg took shape. Largely, this results from the combined support being generated by not only the 100 day EMA, but also one of the support lines of the ascending pitchfork. What’s more, if the loonie fails to break through and then sink lower, the probability of seeing leg five take shape remains relatively slim.
This being said, there are some solid technical signals indicating that, indeed, the move back to the 1.3101 mark is still likely. Firstly, the Parabolic SAR remains in favour of continued downsides and looks to be in little danger of switching back to bullish anytime in the immediate future. Supporting this is the MACD oscillator which, since crossing over last month, has continued to become appreciably more bearish. Finally, we can also look to the two short-term EMA’s as these 12 and 20 day averages recently performed a crossover and remain in a bearish configuration.
Ultimately, we can’t ignore the fundamental factors likely impacting the pair in the coming days. Notably, the BoC is announcing the Overnight Rate shortly, which is currently expected to be left unchanged, but it’s always worth being on guard for surprise outcomes. Potentially more important than the BoC’s rate decision is the Canadian Building data which, if it comes in above expectations, could facilitate the pair’s attempts at pushing through the 100 day EMA. As a result, monitor the economic calendar closely as the week begins to wind down in order to catch any fundamental upsets.
