- All Instrument Types
- Indices
- Equities
- ETFs
- Funds
- Commodities
- Currencies
- Crypto
- Bonds
- Certificates
Please try another search

Loonie Setting Up For Reversal

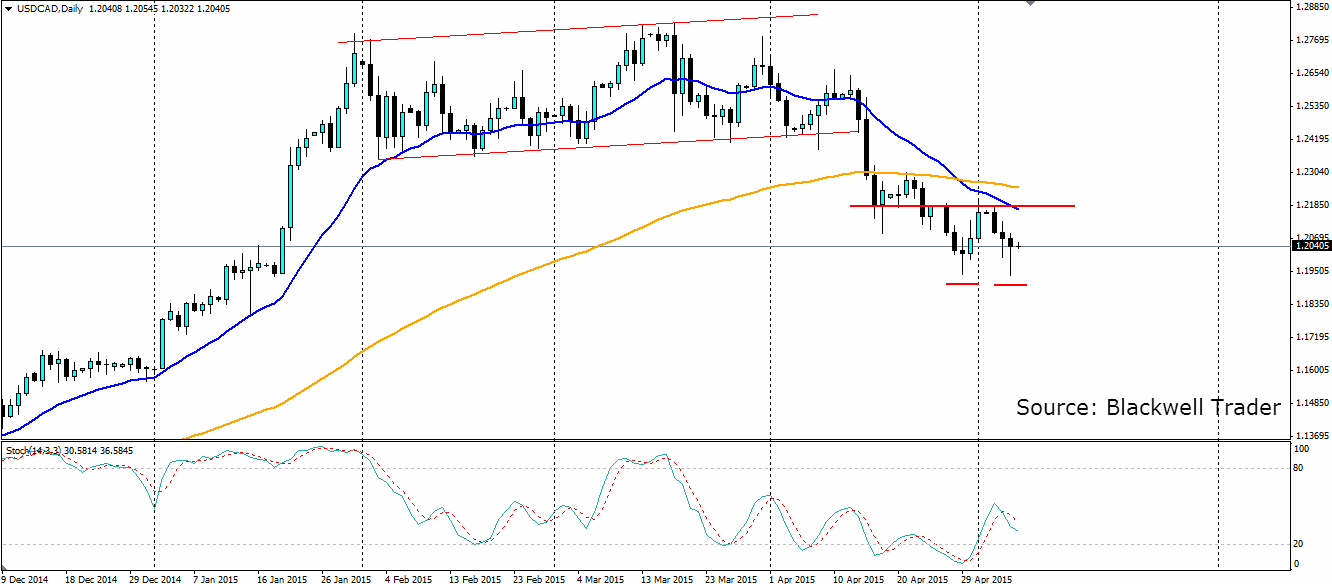
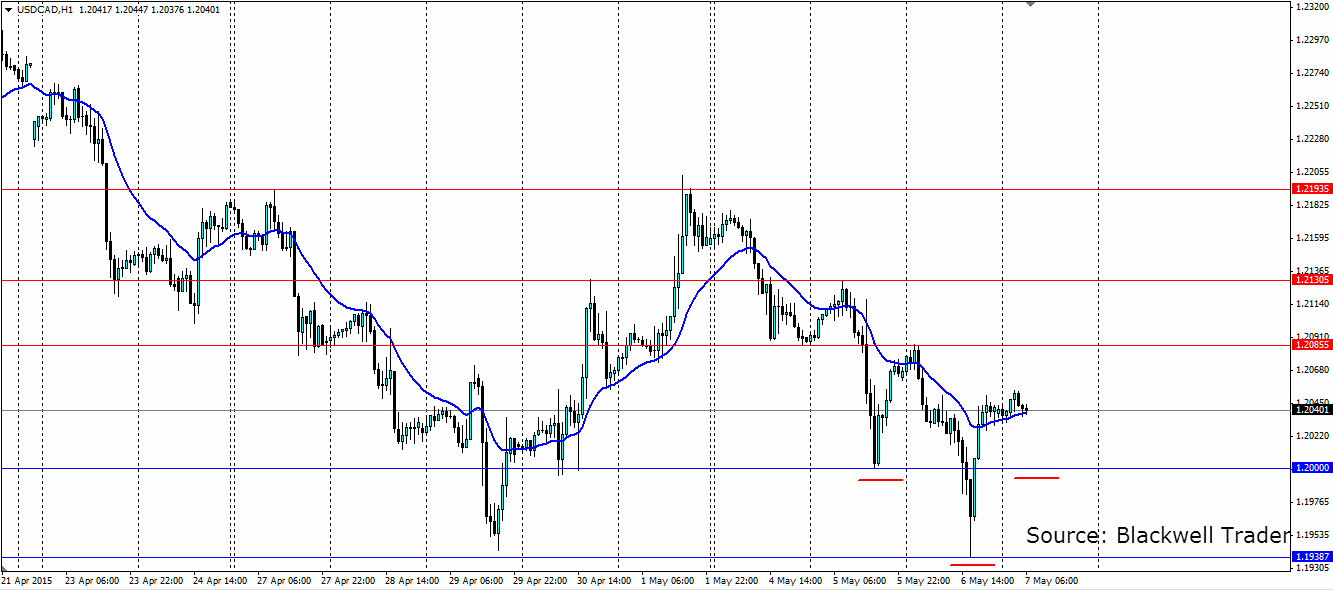
It’s not every day that different time frames set up reversal structures, but that is just what looks to be happening on the USD/CAD pair. The H1 and daily charts are both showing reversals of the short term bearish trend and the overall longer term bearish move.
The recovery in oil prices and the selloff in the US dollar has led to loonie strength that saw the USD/CAD pair break lower out of the range. That move looks to be running out of steam as a double bottom appears on the daily chart. The price has already strongly rejected off this level and a break higher through the neckline will confirm the double bottom as a reversal pattern.
The Stochastic Oscillator on the daily chart is showing divergence that will add weight to the case for a reversal. The price has painted a slightly lower low, but the Stoch has moved sharply back from oversold and looks to now be forming a much higher low.
On the shorter H1 timeframe, we look to be setting up for a reverse head and shoulders pattern that will confirm an end to the short term bearish trend. The strong rejection off the 1.1938 level suggests there are enough buyers in the market to reverse the current trend. Look for a small pull back to the support at 1.2000 which, if it holds, will be the second shoulder we are looking for.
The 1.2000 is obviously a psychological level and one that has acted as a point of support for price several times recently. If we see it hold, look for resistance to be found at 1.2085, 1.2130 and 1.2193 as the price moves higher in the short term.
Related Articles
The Japanese yen is slightly lower on Wednesday. In the North American session, USD/JPY is trading at 148.92, down 0.07% on the day. What is the best performing G-10 currency...

USD/JPY is consolidating near 149.33 on Wednesday, with the yen pausing its rally while holding near four-month highs against the USD. This stabilisation follows renewed support...

The US stock market stabilized yesterday, but there were no significant moves during the US session as speculators remained neutral ahead of Nvidia (NASDAQ:NVDA) earnings, which...
Are you sure you want to block %USER_NAME%?
By doing so, you and %USER_NAME% will not be able to see any of each other's Investing.com's posts.
%USER_NAME% was successfully added to your Block List
Since you’ve just unblocked this person, you must wait 48 hours before renewing the block.
I feel that this comment is:
Thank You!
Your report has been sent to our moderators for review


Add a Comment
We encourage you to use comments to engage with other users, share your perspective and ask questions of authors and each other. However, in order to maintain the high level of discourse we’ve all come to value and expect, please keep the following criteria in mind:
Enrich the conversation, don’t trash it.
Stay focused and on track. Only post material that’s relevant to the topic being discussed.
Be respectful. Even negative opinions can be framed positively and diplomatically. Avoid profanity, slander or personal attacks directed at an author or another user. Racism, sexism and other forms of discrimination will not be tolerated.
Perpetrators of spam or abuse will be deleted from the site and prohibited from future registration at Investing.com’s discretion.