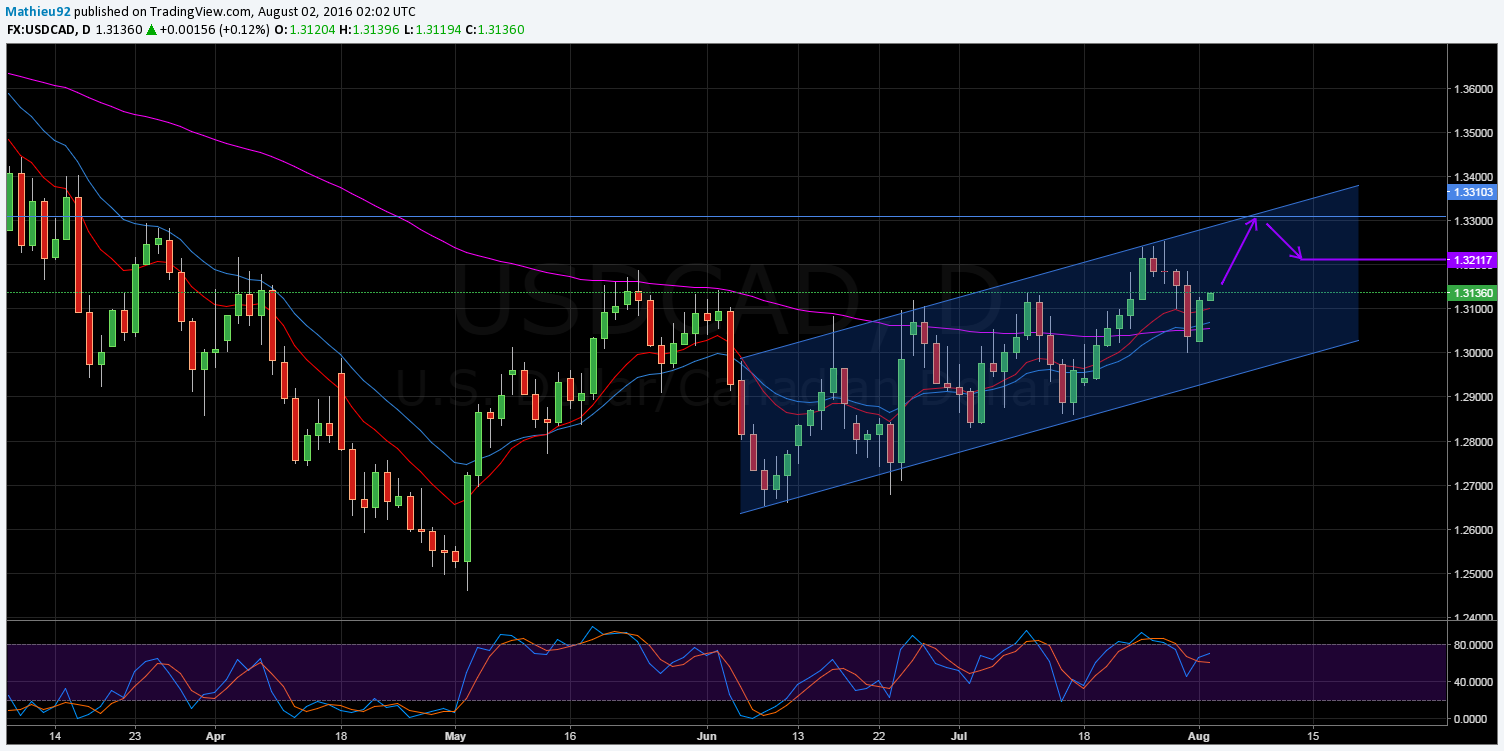
Key Points:
- Bullish channel is now in place.
- Upside bias in the EMA activity and Parabolic SAR readings.
- Breaking the 1.3147 resistance is now key.
After unexpectedly punching through support last Friday, the Loonie has been recovering strongly which could be indicative of the pair’s underlying bullishness. As a result of the tumble, there is now also further evidence suggesting that a rather robust Bullish channel is in place. Additionally, EMA activity and Parabolic SAR readings are biased towards the upside which should help to see the upper constraint of the channel challenged again.
Firstly, whilst the voracity of Friday’s plunge might at first look to be signalling a potential bearish reversal for the pair, the downside breakout is largely anomalous. Specifically, the rather significant and, in this author’s mind at least, unwarranted plunge can largely be attributed to the unexpectedly poor US Advance GDP figure released during the session. In fact, the almost equally tenacious rally seen in the subsequent session goes someway in confirming that the rout may have been a knee-jerk response.

Now that the Loonie has effectively recovered from Fridays slip, bullish momentum should continue over the next week or so. As shown above, the presence of a bullish channel should make itself felt and keep the USDCAD recovering modestly in the short to medium term. However, gains are likely to be capped around the 1.3310 mark which represents a long-term zone of resistance. This point represents a 38.2% Fibonacci retracement level and intersects the upside constraint of the bullish channel. As a result of this, resistance here should prove difficult to breakthrough especially as stochastics will be screaming overbought at this level.
Aside from the channel formation, EMA activity and Parabolic SAR readings are still showing a strong bullish bias. Notably, the 100 day EMA is now upward sloping and has crossed over with the already bullish 12 and 20 day EMA’s. Of course, this is a highly bullish configuration which is supported by the Parabolic SAR readings. Whilst not shown on the above daily chart, the indicator remains in favour of an uptrend and this is replicated across multiple shorter timeframes.
Ultimately, even with the recent setbacks, there remains a strong case for ongoing bullishness for the Loonie. As discussed, the presence of a channel and the bullish bias of the EMA activity are some key reasons not to doubt the pair’s ability to push higher. Currently, the USDCAD is contenting with the longstanding resistance around the 1.3147 mark. Breaking through here will likely be the event which triggers a resumption of the Loonie’s recent momentum and, therefore, should be watched out for.
