Momentum investing, which can be described as investing in prior winners and avoiding—or even selling short—prior losers, is a viable investment strategy. Traders and investors using this strategy when making buy and sell decisions, typically pay attention to trends, which, in part, brings us to technical analysis.
Research led by Lawrence Takeuchi of Stanford University highlights:
“This momentum effect continues to remain robust in the U.S. after becoming widely known and applies to international stocks as well as other asset classes, including foreign exchange, commodities and bonds.”
A large number of market participants look at technical indicators when analyzing financial assets to gauge the strength of a trend in a given asset price. Technical analysis assumes that prices move in trend and have momentum. Therefore, a trend continues until a reversal.
Without entering into a comprehensive discussion of technical analysis, we should note that drawdowns can be large and stomach-churning in momentum strategies.
We previously discussed a momentum fund, namely the JPMorgan U.S. Momentum Factor ETF (NYSE:JMOM). Today, we introduce two more momentum funds that may pique readers' interest.
1.iShares MSCI USA Momentum Factor ETF
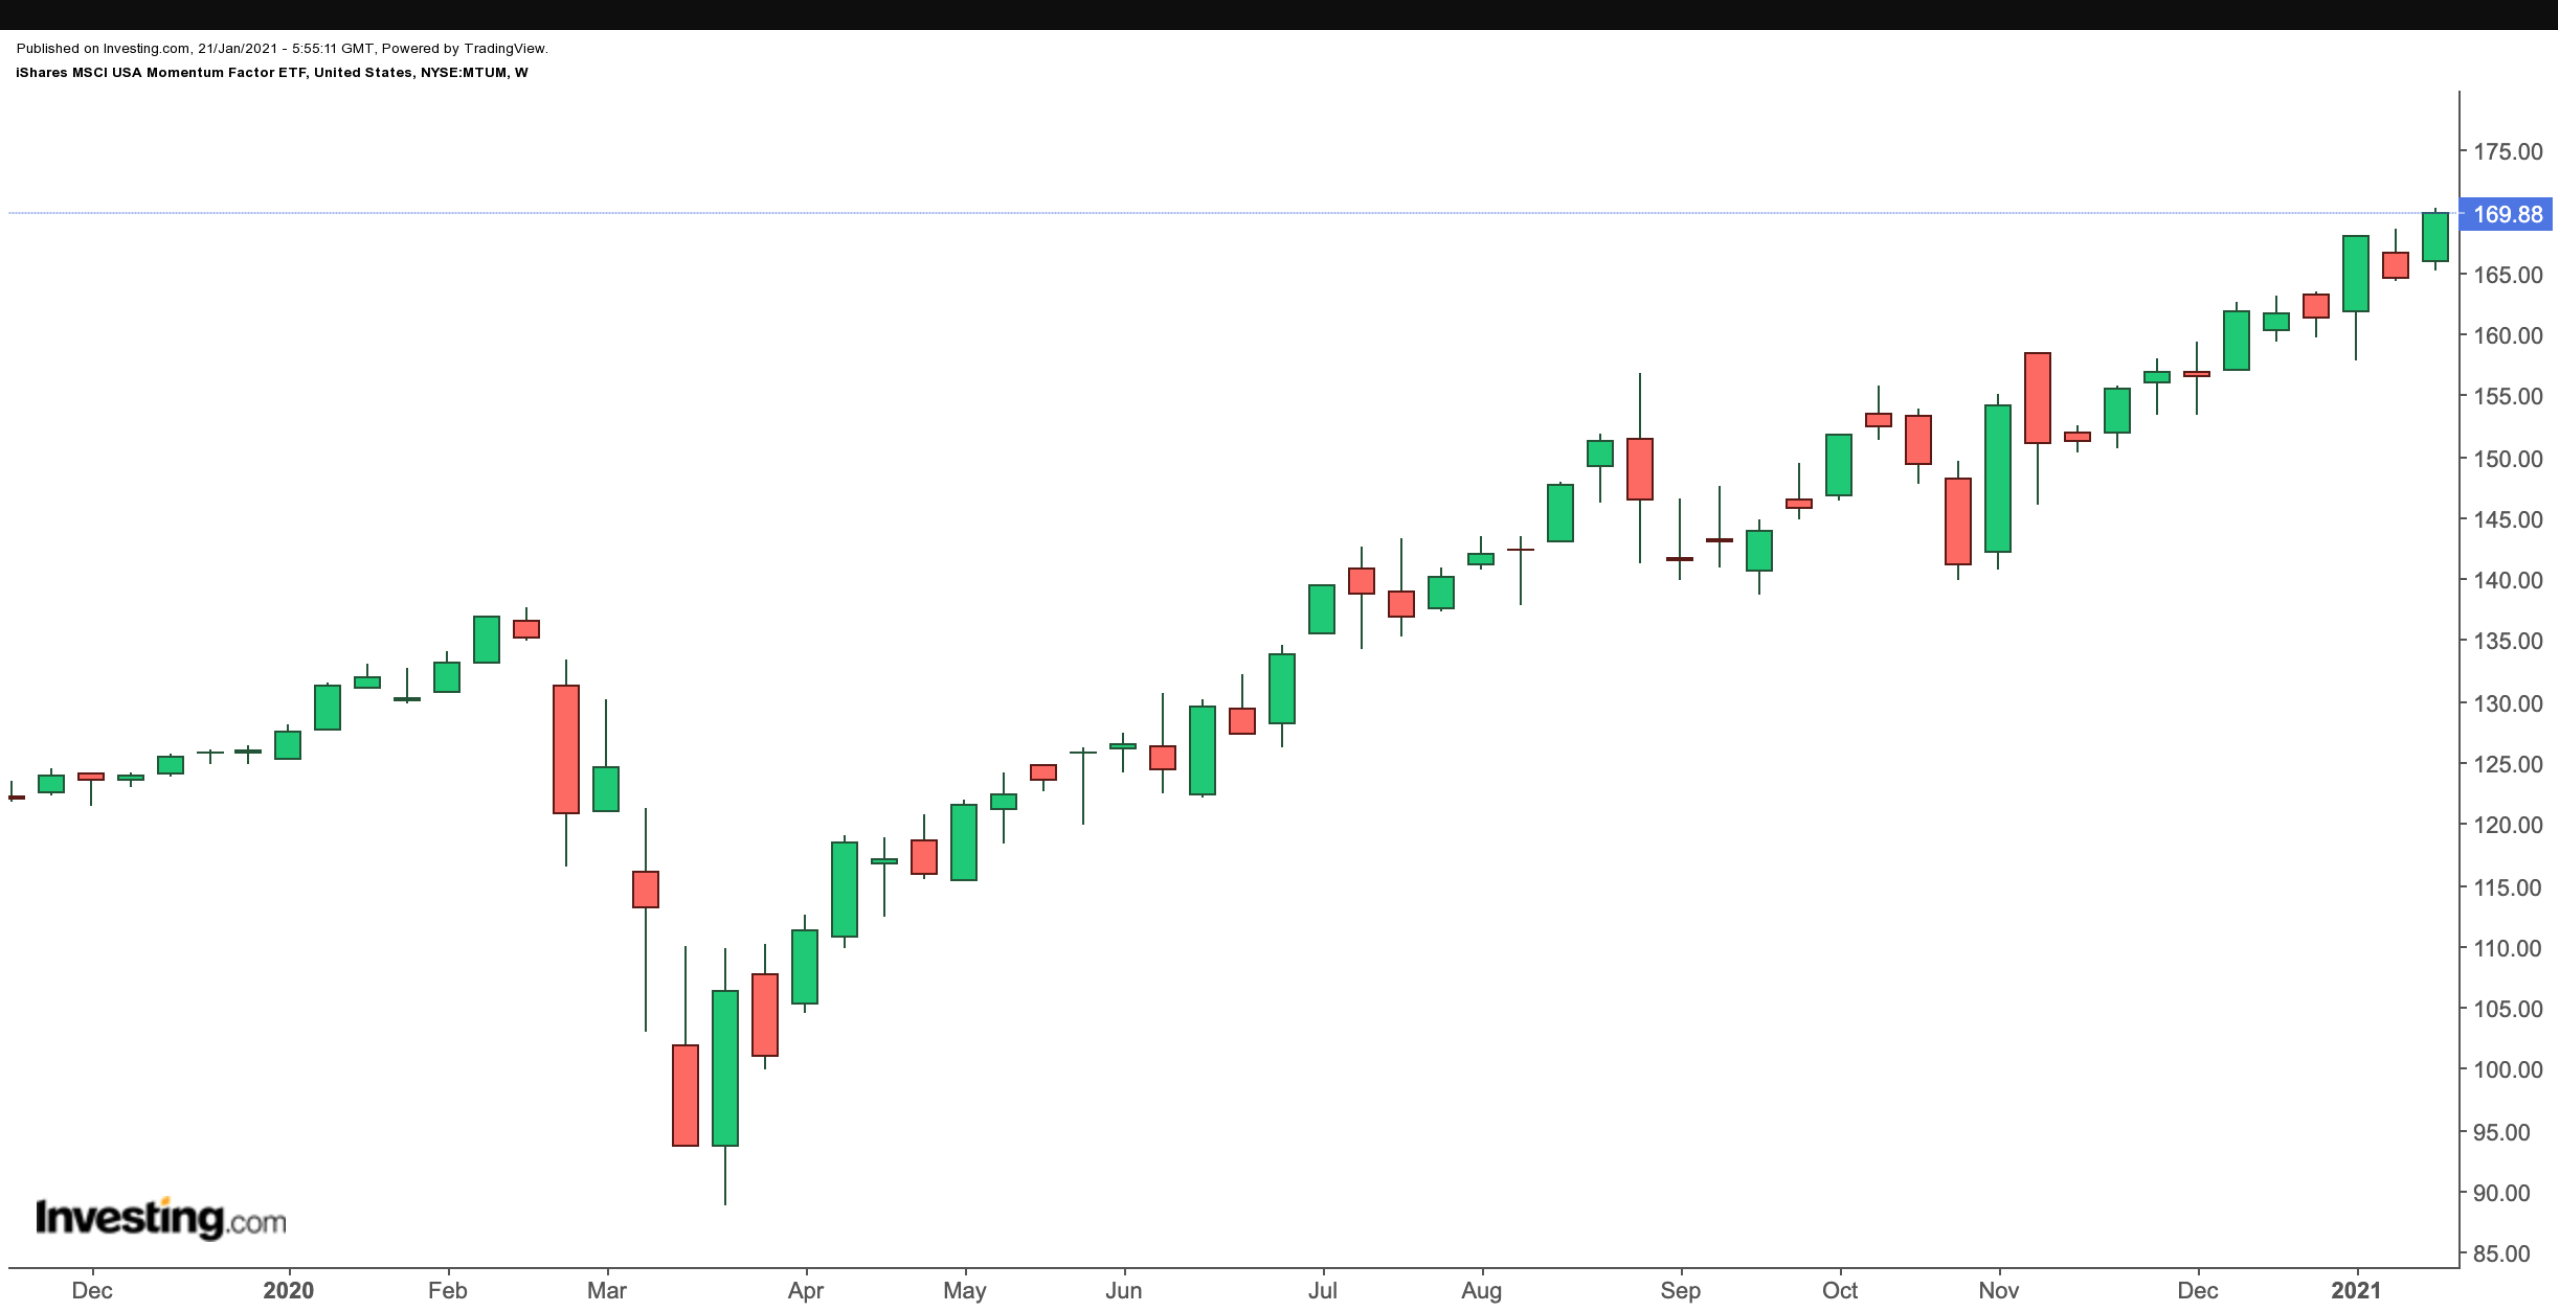
Current Price: $169.88
52-Week Range: $88.83 - $170.21
Dividend Yield: 0.81%
Expense Ratio: 0.15%
The iShares MSCI USA Momentum Factor ETF (NYSE:MTUM) provides exposure to stocks with high price momentum.

MTUM, which tracks the MSCI USA Momentum SR Variant Index, has 125 holdings. The fund started trading in April 2013 and has $13.7 billion under management.
In terms of sectors, Information Technology has the highest weighting with 41.38%, followed by Consumer Discretionary (21.45%), Health Care (12.69%), Communication (10.88%), Industrials (7.14%) and others. The leading 10 businesses comprise almost 40% of the ETF.
Tesla (NASDAQ:TSLA), Apple (NASDAQ:AAPL), Microsoft (NASDAQ:MSFT), Amazon (NASAQ:AMZN) and NVIDIA (NASDAQ:NVDA) are the top names in the fund.
In the past year, MTUM increased by 26% and hit a record high on Jan. 20. Most readers would be familiar with how strong the positive momentum has been in many of the names above, contributing to the fund’s returns. In the coming days, many stocks in the ETF will be reporting earnings. As a result, we can expect volatility to increase. Potential investors may be able to enter MTUM at a lower price. Nonetheless, these names are likely to continue to be in long-term portfolios in the coming quarters, too.
On a final note, options are available on MTUM, making it possible to put together more advanced trading strategies.
2. Global X Adaptive U.S. Risk Management ETF
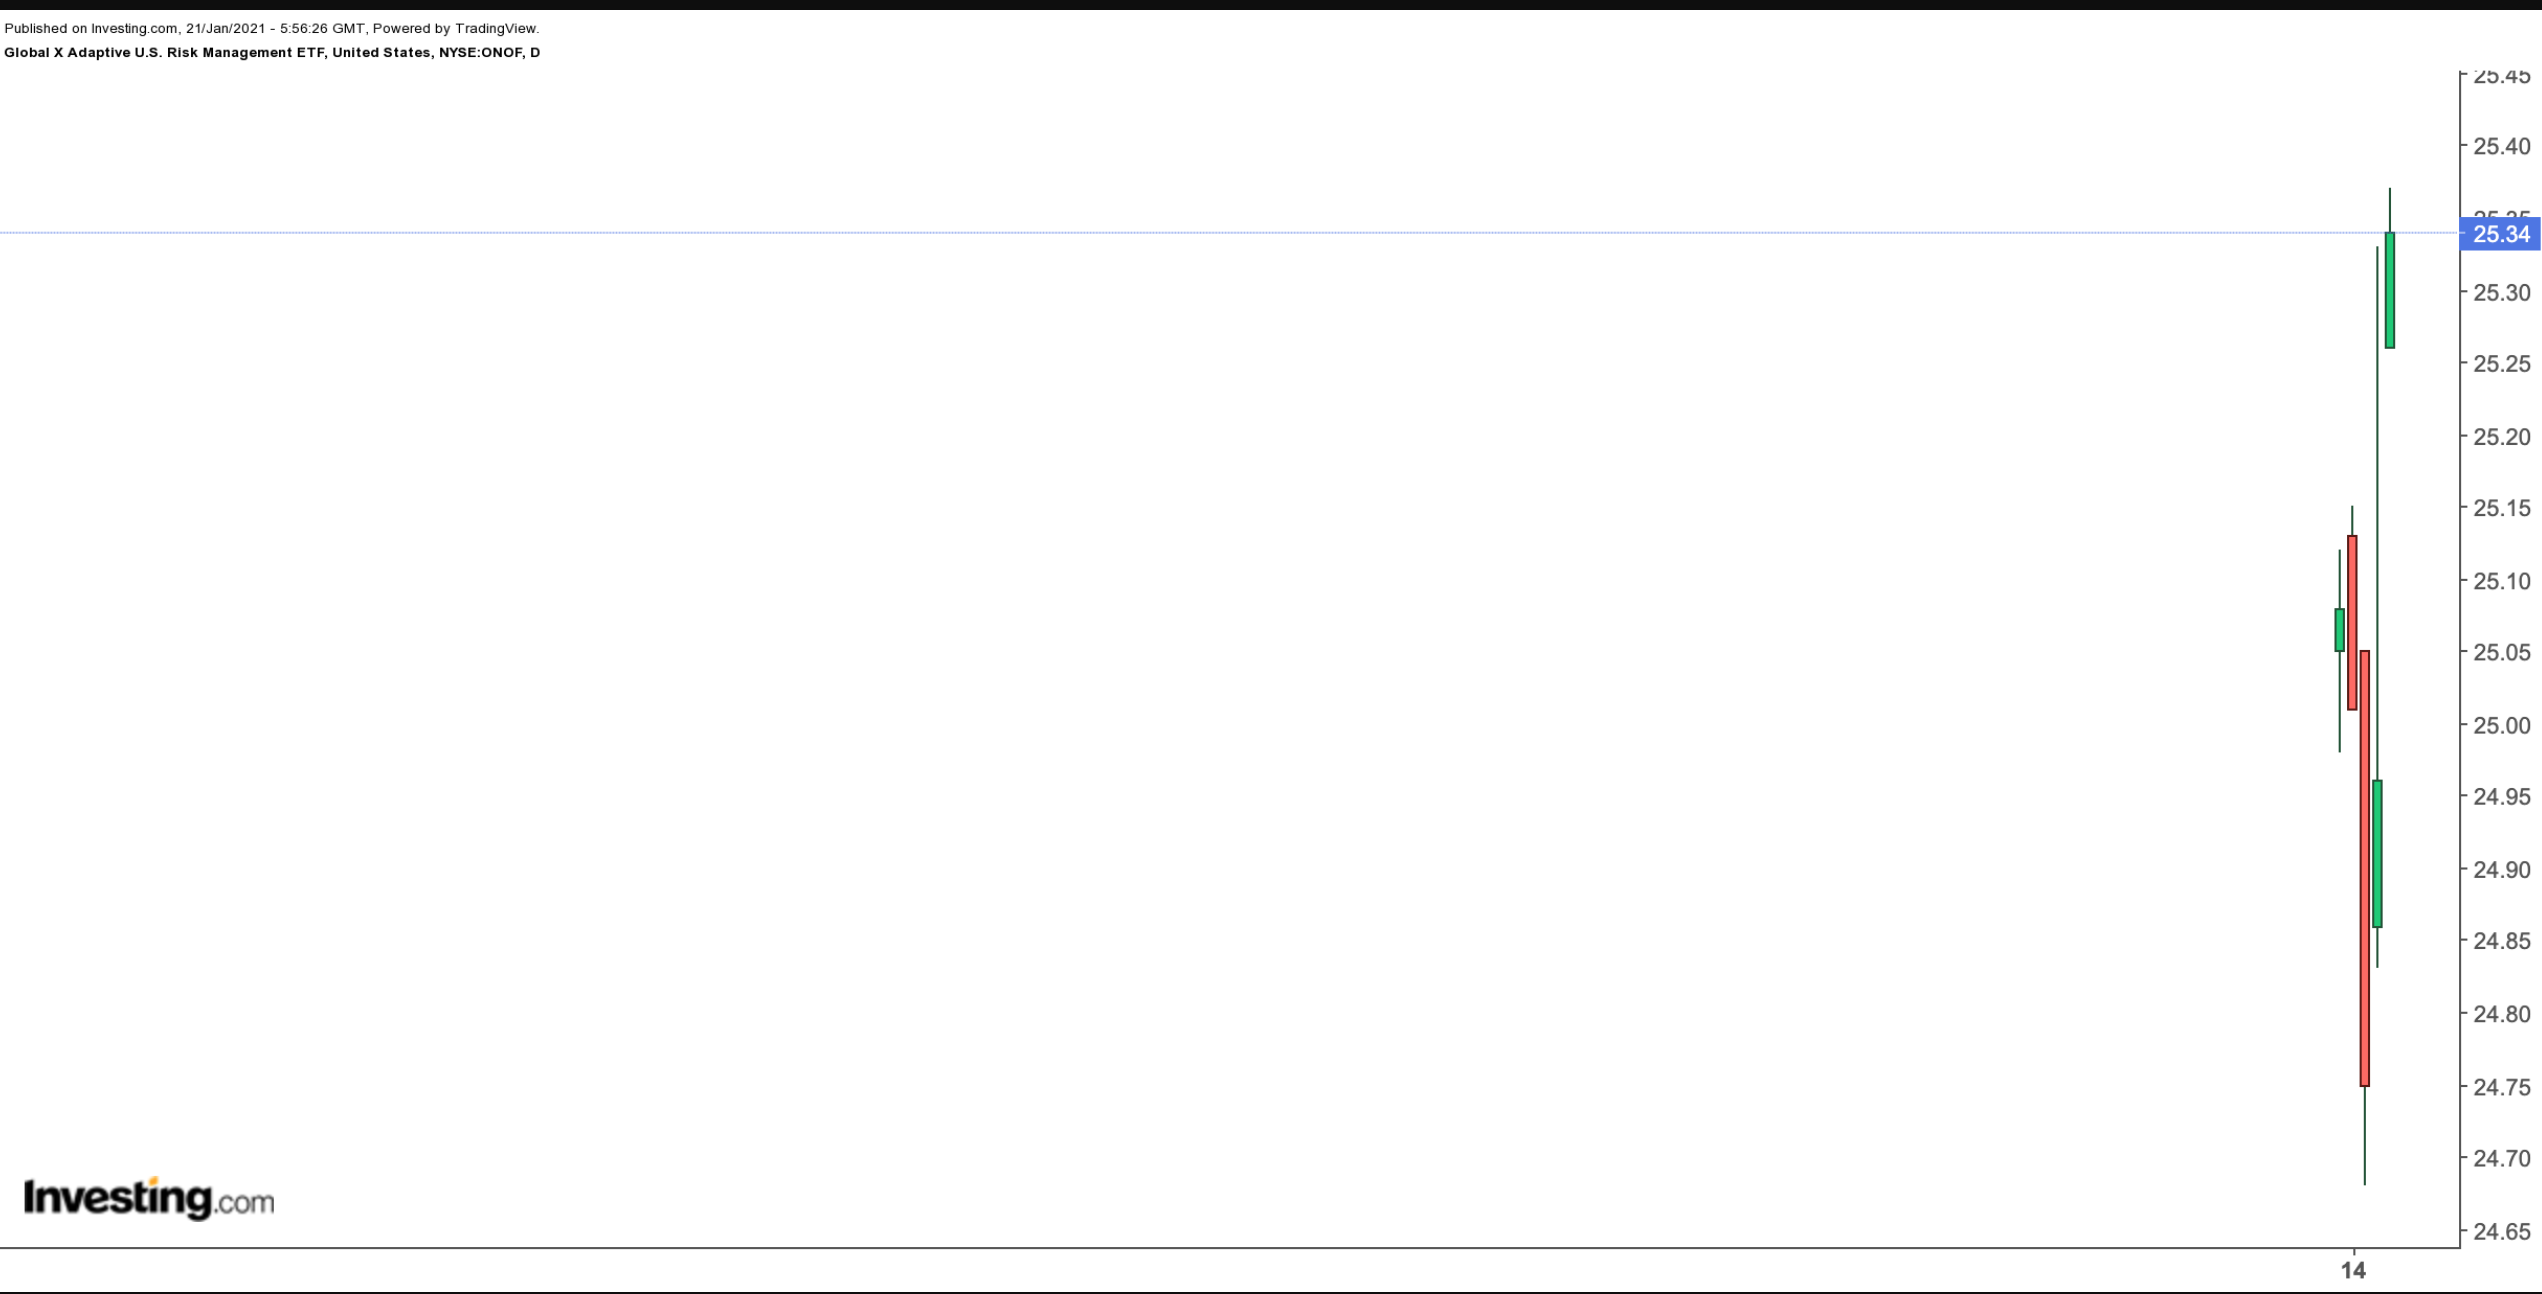
Current Price: $25.34
52-Week Range: $24.68-$25.33
Expense Ratio: 0.39%
The Global X Adaptive U.S. Risk Management ETF (NYSE:ONOF) is a young actively-managed fund that started trading last week. Therefore, assets under management are about $23 million.

Fund managers use several technical indicators to decide on their equity allocation strategy. For those readers who employ technical analysis in their research process, those four indicators are moving average, convergence/divergence (MACD), drawdown and volatility.
If these indicators point to a positive trending environment, then the fund participates in equity markets. Otherwise, the fund may become defensive and move to a risk-off position by investing in short-term U.S. treasuries.
ONOF, which has 511 holdings, tracks the Adaptive Wealth Strategies US Risk Management Index. The top 10 companies make up close to a third of the fund. Apple, Microsoft, Amazon, Tesla and Facebook (NASDAQ:FB) lead the names in the roster.
The two funds we have discussed today as well as many other ETFs available have put the tech darlings of Wall Street at the top of their list. In 2020, they became portfolios of winners.
Because of its short trading history, it is not possible to talk about returns over the past year. However, we believe ONOF deserves to be on the radar of investors who follow momentum indicators. It would be important to see how the fund behaves in the case of declines in these names.
In other words, we do not yet know if the the technical indicators that the fund follows make the managers take a defensive position and move into Treasuries.
