When I was a newly minted engineer, I was told that I had no business calculating dynamic loading if I did not already know the what the design of the final product would look like. The calculation was to prove what you had already envisioned. It is a quality control step - and differences between what was envisioned and what was calculated is reconciled. Not knowing what the final product will look like subjects the process to order-of-magnitude / quantitative errors or methodology defects.
Follow up:
When you sift through raw data day after day, you already have modeled economic movement in you mind. One's mind subtly is analyzing all the data and drawing its own conclusion. So when I analyze a data release or develop an economic forecast - I pretty much know what the answer should be.
The USA economy is not doing well - and the elements which brought us the Great Recession (or were created in their aftermath) are still visiting with no end in sight for their departure. The economy continues to cycle between half-arsed growth and growth which needs to be viewed under a microscope to measure.
There are two issues to keep in mind as the year progresses:
- As the economy cycles, most analysts keep their eyes on year-over-year change. When the economy was accelerating a year ago, and sluggish today - the rate of growth year-over-year deteriorates. That is what is happening now - the data looks soft. But beginning next year, the current data will be judged against the soft data we are seeing now - likely growth will feel like it picked up.
- There are events (China currency valuation and the terrible harbor destruction at Tainjin) whose affects will adversely migrate into the data.
It is the second point which I am most concerned. China's currency devaluation strengthens the dollar (adversely affecting USA based multinational income - and making USA exports more expensive). If the Fed decides to raise rates, it will compound the pressure strengthening the dollar. IMO, the economic growth for 2016 is being undermined.
One of my favorite metrics to forecast the economy is the container counts for the ports of Los Angeles and Long Beach. This metric may be unusable in the coming months due to the destruction at Tainjin. One media source speculated:
Long Beach and Los Angeles stand to lose the most cargo, as in the first half of 2015 they handled 34 and 13 percent, respectively, of U.S. imports from the port that saw operations disrupted after two explosions. The Port of of New York and New Jersey also could take a hit, as it handled roughly 11 percent of Tianjin’s exports to the U.S. in the first half.
Much of the materials will be rerouted to other ports - but how much and how much delay will there be? It is not as though imports were running in high gear. From our analysis this week on movements in the Ports of Los Angeles and Long Beach.
The data for this series continues to be less than spectacular - but improved this month. The year-to-date volumes contracting for both imports and exports. This continues to indicate weak economic conditions domestically and globally.
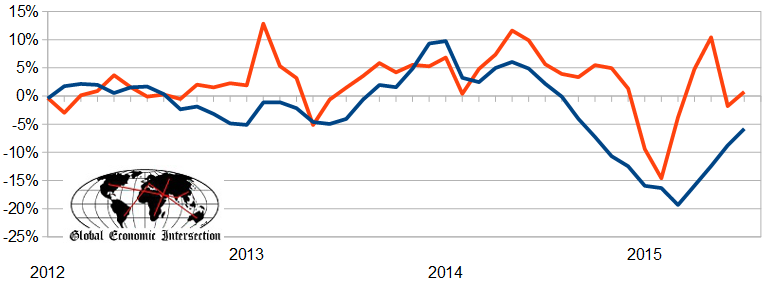
Acceleration Month-over-Month Change from One Year Ago Year to Date vs. Previous Year 3 Month Rolling Average vs. Average One Year Ago Acceleration 3 Month Rolling Average Imports +10.2% +5.5% -1.5% +0.7% +2.5% Exports +7.2% -2.4% -12.5% -5.8% +2.9% As the data is very noisy - the best way to look at this data is the 3 month rolling averages. There is a direct linkage between imports and USA economic activity - and the change in growth in imports foretells real change in economic growth. Export growth is an indicator of competitiveness and global economic growth.
The continued under-performing of exports is not a positive sign for GDP as the year progresses.
Unadjusted 3 Month Rolling Average for Container Counts Year-over-Year Change (comparing the 3 month average one year ago to the current 3 month average) - Ports of Los Angeles and Long Beach Combined - Imports (red line) and Exports (blue line)
There is reasonable correlation between the container counts and the US Census trade data also being analyzed by Econintersect. But trade data lags several months after the more timely container counts.
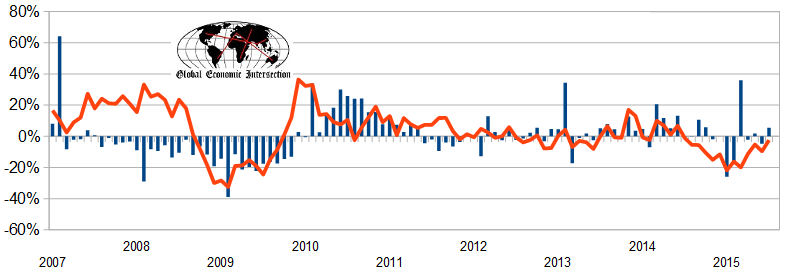
Unadjusted Year-over-Year Change in Container Counts - Ports of Los Angeles and Long Beach Combined - Imports (red line) and Exports (blue bars)
Tainjin will prove to be an economic drag. It is not as though either imports or exports were doing that well without this incident.
Other Economic News this Week:
The Econintersect Economic Index for August 2015 declined to the lowest level since April 2010. The tracked sectors of the economy remain relatively soft with most expanding at the lower end of the range seen since the end of the Great Recession. Our economic index has been in a long term decline since late 2014.
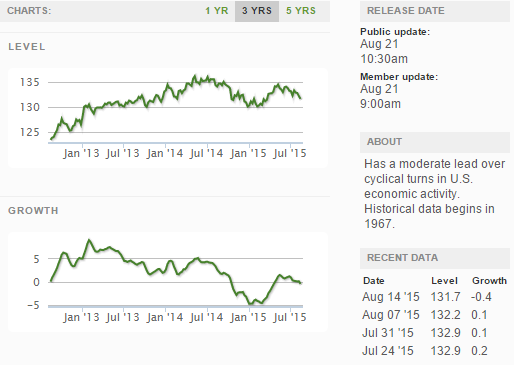
The ECRI WLI growth index is now in positive territory but still indicates the economy will have little growth 6 months from today.
Current ECRI WLI Growth Index
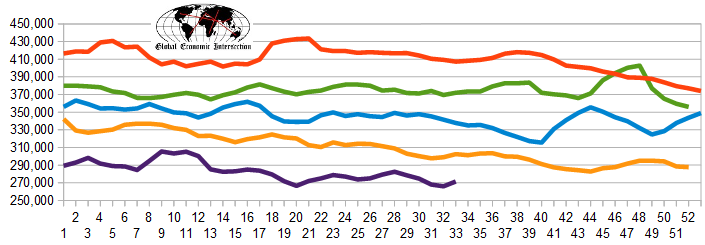
The market was expecting the weekly initial unemployment claims at 265,000 to 274,000 (consensus 270,000) vs the 277,000 reported. The more important (because of the volatility in the weekly reported claims and seasonality errors in adjusting the data) 4 week moving average moved from 266,000 (reported last week as 266,250) to 271,500. The rolling averages generally have been equal to or under 300,000 since August 2014.
Weekly Initial Unemployment Claims - 4 Week Average - Seasonally Adjusted - 2011 (red line), 2012 (green line), 2013 (blue line), 2014 (orange line), 2015 (violet line)
Bankruptcies this Week: Boomerang Systems
Click here to view the scorecard table below with active hyperlinks
Weekly Economic Release Scorecard:
