Commodities and industrial metals have historically moved in tandem.
However, recent market dynamics highlight that this correlation has started to change.
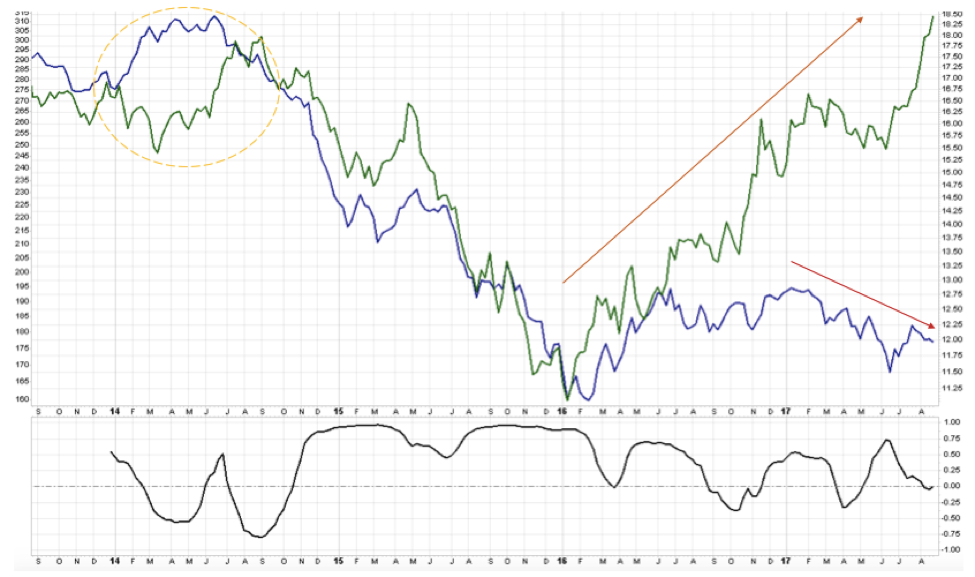
Commodities have not moved past resistance levels, and instead have continued on a downtrend. Industrial metals traded sideways at the beginning of 2017, but have shown recent strength with the latest rally.
In the graph below, the green line represents the DBB (NYSE:DBB) index and the blue line represents the CRB index. The analysis at the bottom is the correlation between CRB and DBB index. It should be noticed that historically it has been positive.

Source: MetalMiner Analysis of FastMarkets
Why the Divergence?
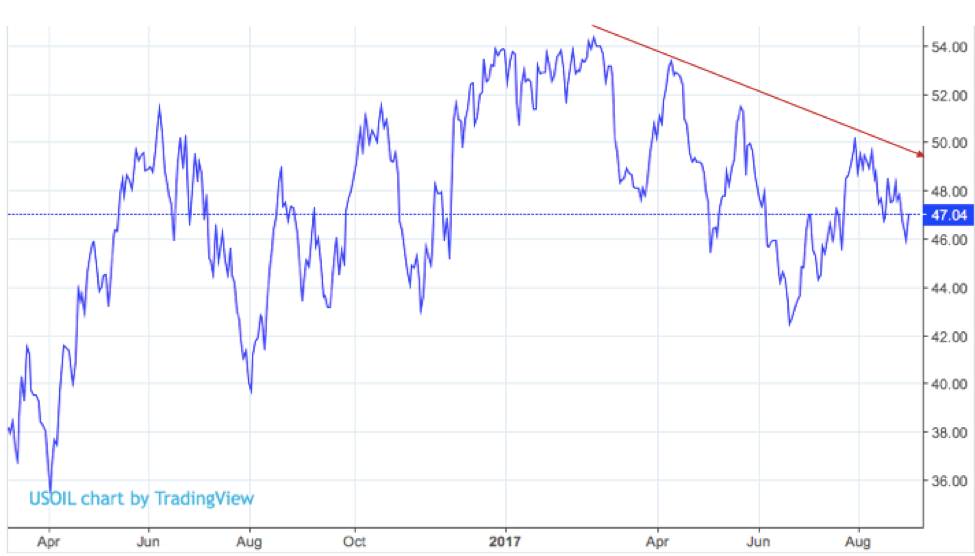
First, readers should understand what exactly the CRB index contains. Energy accounts for 39% of the CRB index, while agriculture is 41%. Base and industrial metals make up only 13% of the mix. Thus, oil prices (what we actually look at as a critical indicator) have an outsized impact on the CRB index. Oil prices have been down since the beginning of 2017, as have commodities.

Oil prices. Source: MetalMiner Analysis of TradingEconomics
In terms of industrial metals, most of the base metals have rallied this month. Aluminum, copper and zinc, particularly, were the best performers of the month. Prices have increased steadily and show strength to continue rising.
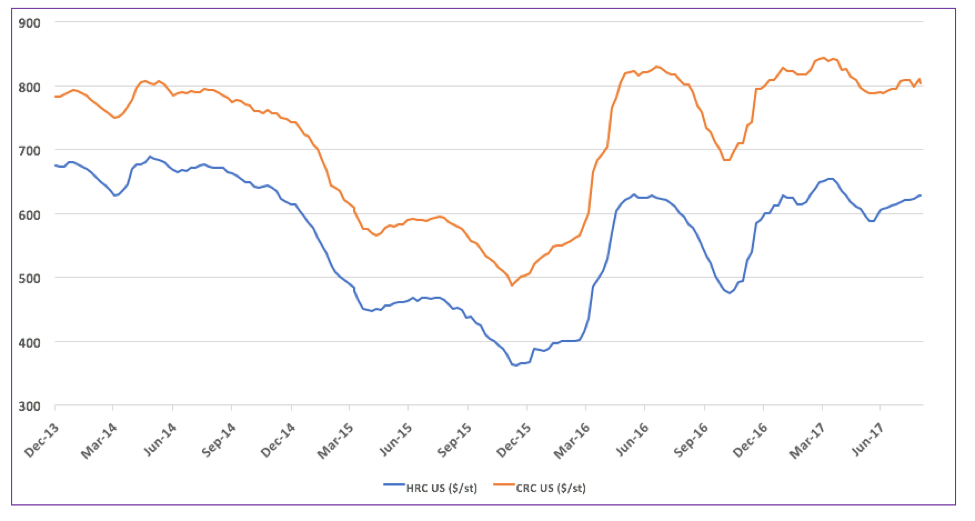
Steel forms seem to have lost a little steam, but prices are still increasing. Steel prices have been in an uptrend since November 2016.

Source: MetalMiner Index
Both steel and base metals price increases have contributed to the uptrend in industrial metals, which now appears to have taken off like a rocket.
What Can Buying Organizations Expect?
Even if the source of the current lack of correlation is clear, MetalMiner believes that one of the two (commodities or industrial metals) may show a change of trend at some point soon.
One can move the other, and that is why buying organizations should track price movements in each.
by Irene Martinez Canorea
