Exchange-traded funds (ETFs) have been growing in number and evolving in style. Smart Beta (SB) ETFs, a new class of funds that aim to provide enhanced returns, have been getting significant attention.
Denys Glushkov of the University of Pennsylvania says:
"SB funds aim to enhance returns and/or minimize risk relative to traditional cap-weighted counterparts by tilting portfolios towards various rewarded factors."
In other words, while they track an index, smart beta funds also have additional rules that guide fund sponsors. Those parameters might consist of low volatility, value, growth, quality, dividends or momentum.
According to BlackRock (NYSE:BLK), which has 800 ETFs globally and $1.9 trillion in assets under management: "Factors are the persistent and well-documented asset characteristics that have historically driven investment risk and return.”
Today we introduces two of these funds that might appeal to a range of investors. However, we should remind readers that the debate on the long-term performance of smart beta ETFs is ongoing.
Research by Burton G. Malkiel of Princeton University points out:
“Smart beta portfolios do not consistently outperform and when they do produce appealing results, they flunk the risk test.”
Therefore, potential investors need to do due diligence in light of their own portfolio objectives.
1. First Trust Capital Strength ETF
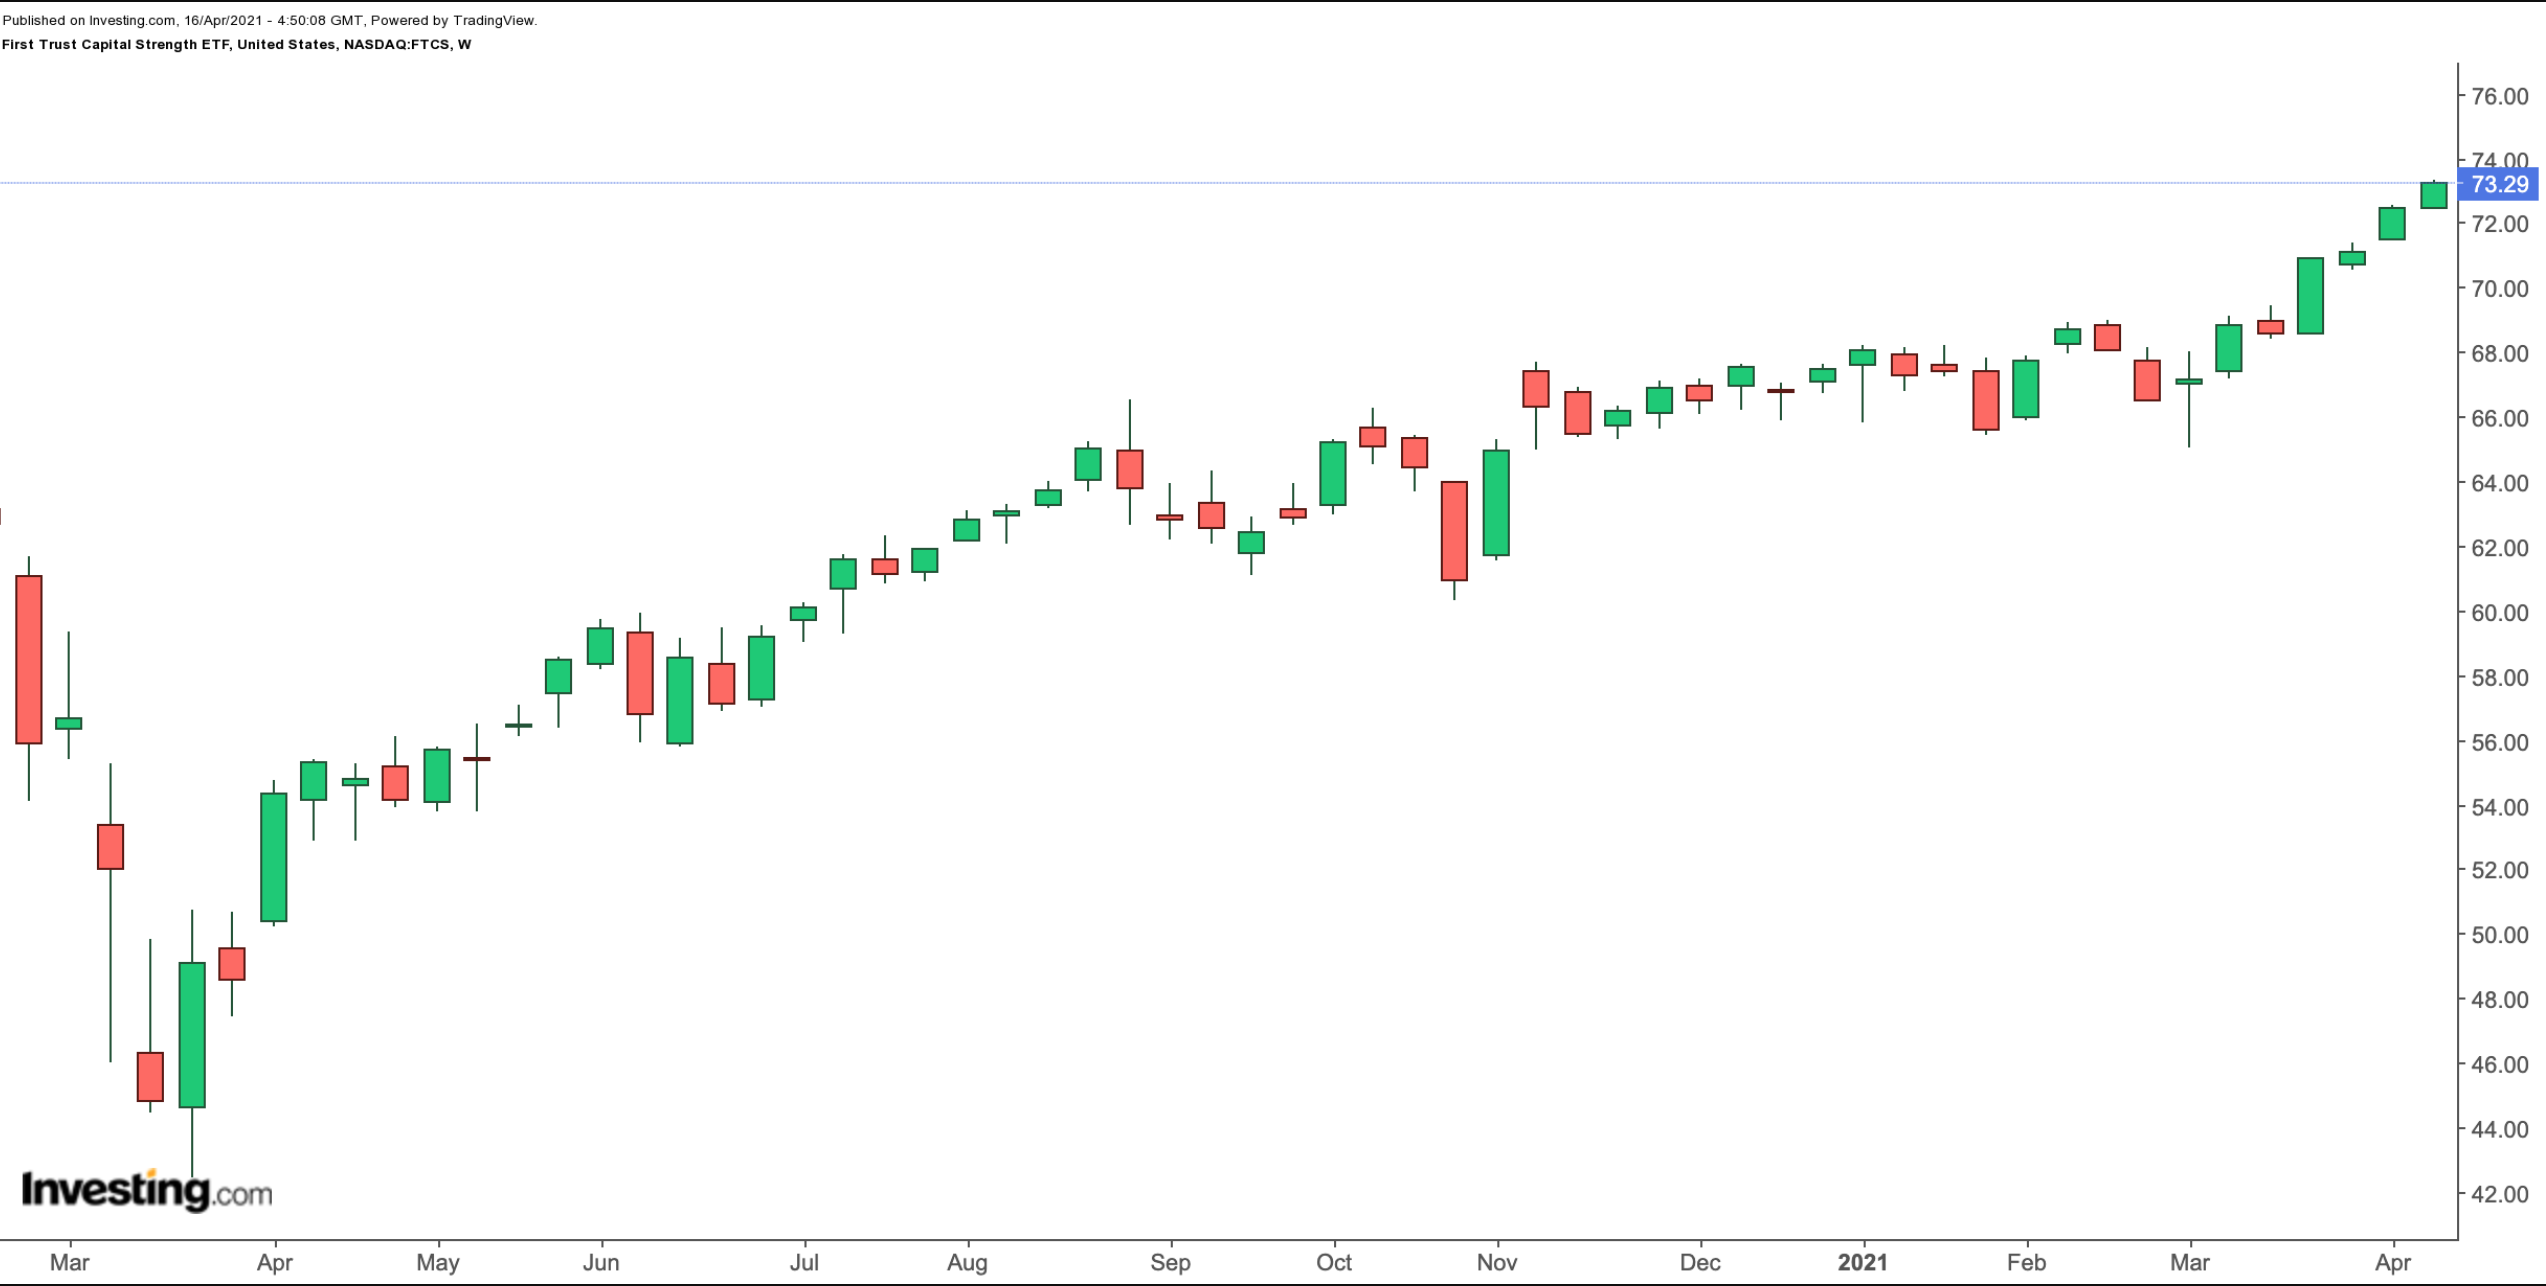
Current price: $73.29
52-Week Range: $52.89 - $73.31
Dividend Yield: 0.98%
Expense Ratio: 0.58%
The First Trust Capital Strength ETF (NASDAQ:FTCS) tracks the returns of the Capital Strength Index. The fund started trading in July 2006. Its net assets stand at $7.6 billion.

This index provides exposure to equities chosen from the largest 500 companies in the NASDAQ US Benchmark Index. Selected stocks should have a minimum of three-month average daily trading volume of $5 million. In addition, they should have at least $1 billion in cash or short-term investments, a long-term-debt-to-market-cap ratio of less than 30% and a return on equity greater than 15%.
Then, eligible firms are ranked by a combined short-term (90 days) and long-term (260 days) realized volatility.
Finally, the 50 companies with the lowest combined volatility score are included in the index, which is rebalanced quarterly.
In terms of sectors, industrials have the highest allocation (30.67%), followed by consumer discretionary (21.32%), consumer staples (13.54%) and technology (11.12%). None of the 50 stocks in the ETF has a weighting of more than 2.5%. Thus, short-term price moves in any one company cannot affect the value of the fund significantly.
Seagate Technology (NASDAQ:STX), which provides electronic data storage solutions; Google’s parent company Alphabet (NASDAQ:GOOGL) (NASDAQ:GOOG); tech giant Microsoft (NASDAQ:MSFT); aerospace and defense group General Dynamics (NYSE:GD); and diversified industrial conglomerate 3M (NYSE:MMM) lead the names in the roster.
In the past year, FTCS returned more than 35% and hit an all-time high on Apr. 15. Trailing P/E and P/B ratios are 24.46 and 7.05, respectively.
We’re in the middle of a busy earnings season. Therefore, short-term volatility and profit-taking are likely in many of the names in the ETF. Interested investors would find better value between $67.5 - $70.
2. Goldman Sachs ActiveBeta Emerging Markets Equity ETF
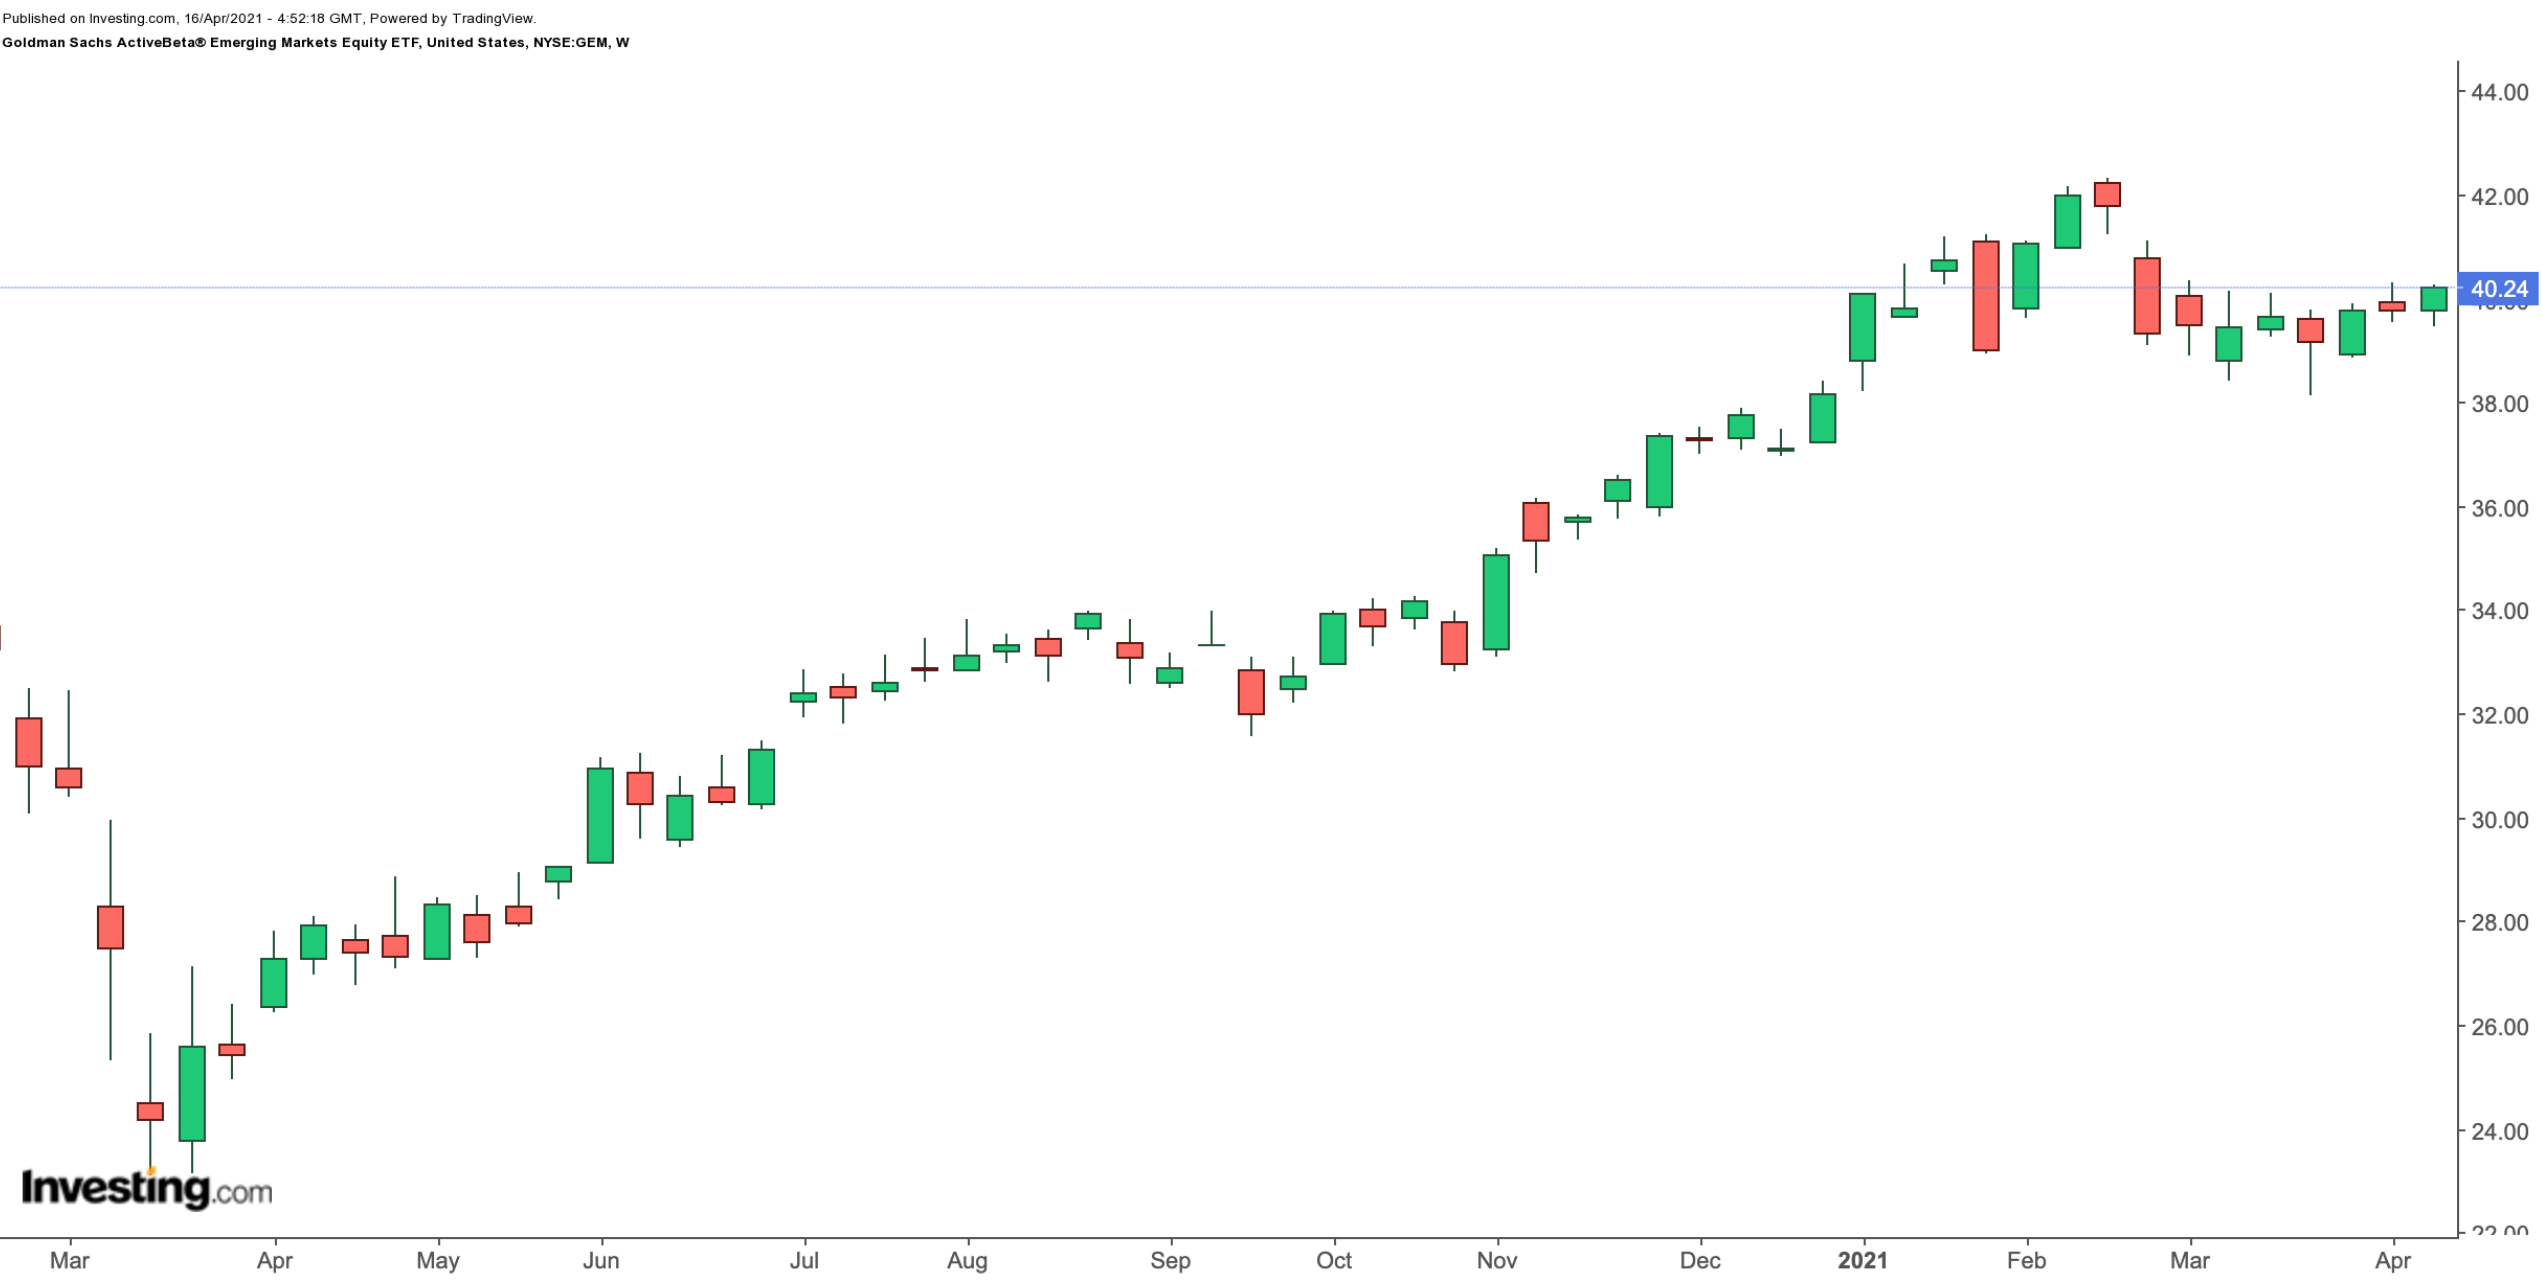
Current Price : $40.24
52-Week Range: $26.76 - $42.31
Dividend Yield: 1.20%
Expense Ratio: 0.45%
The Goldman Sachs ActiveBeta® Emerging Markets Equity ETF (NYSE:GEM) provides broad exposure to emerging market businesses that fund managers believe exhibit good value, strong momentum, high quality and low volatility.

GEM currently has 418 holdings, and the benchmark index is the {{0|Goldman Sachs}} ActiveBeta Emerging Markets Equity Index. Since its inception in September 2015, net assets in the fund have reached $1.35 billion.
Firms from China top the list (32.3%), followed by Taiwan (17.1%), South Korea (16.0%), India (9.7%), Brazil (5.3%) and South Africa (3.9%). In terms of sectors, information technology has the largest slice (23.8%). Next in line are consumer discretionary (16.5%), financials (15.2%) and communication services (12.8%).
Among the leading names in the fund are chip giant Taiwan Semiconductor Manufacturing (NYSE:TSM); technology conglomerate Tencent (OTC:TCEHY); e-commerce, cloud computing and artificial intelligence group Alibaba (NYSE:BABA); Samsung Electronics (OTC:SSNLF), which manufactures consumer and industry electronics; and food ordering and delivery platform Meituan (OTC:MPNGF).
Over the past year, GEM has returned more than 46%, and hit a record high in mid-February. The fund’s trailing P/E and P/B ratios are 18.22 and 2.10, respectively.
Given the high valuation levels in many U.S.-based stocks, a large number of investors are beginning to look beyond the U.S. borders. Those investors who are bullish on emerging markets with an emphasis on China might consider buying the dips in the fund. As the post-pandemic economic recovery gains steam worldwide, with its rules-based, systematic approach, GEM could help investors diversify their portfolios.
