By now you know that my swing trading approach is to focus on the 5-6 Month Intermediate Cycle Low (ICL) to establish positions. It seems that everything that I track has the 5-6 month low to low cycle. Sometimes the ICLs come sooner at 4 months or later at 7+ months but the average is 5-6 months.
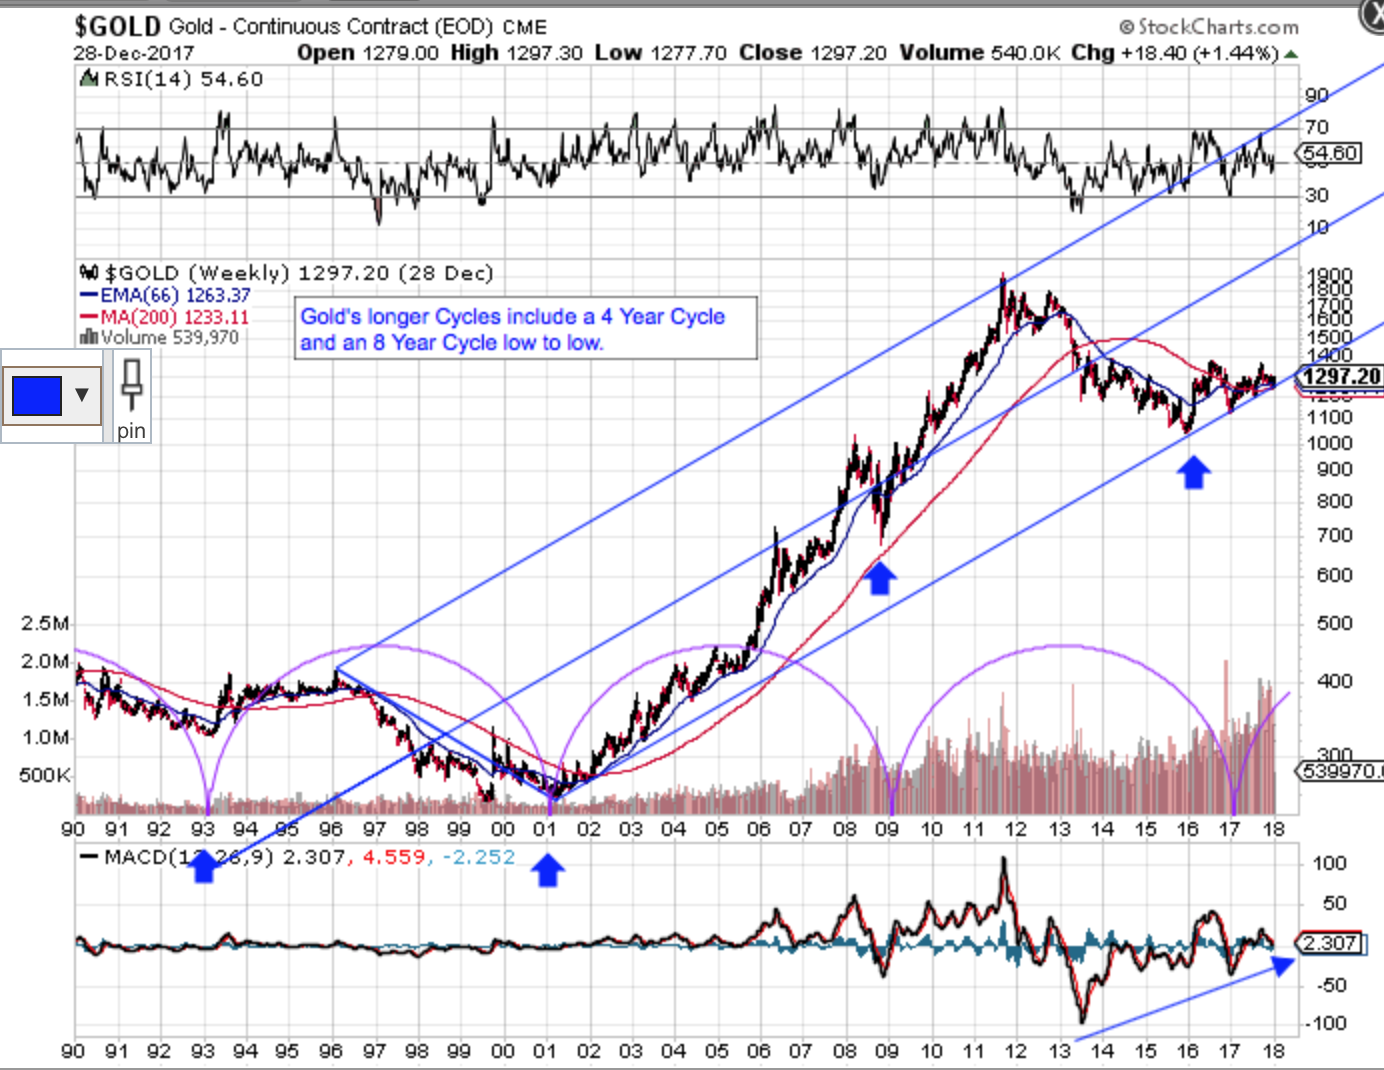
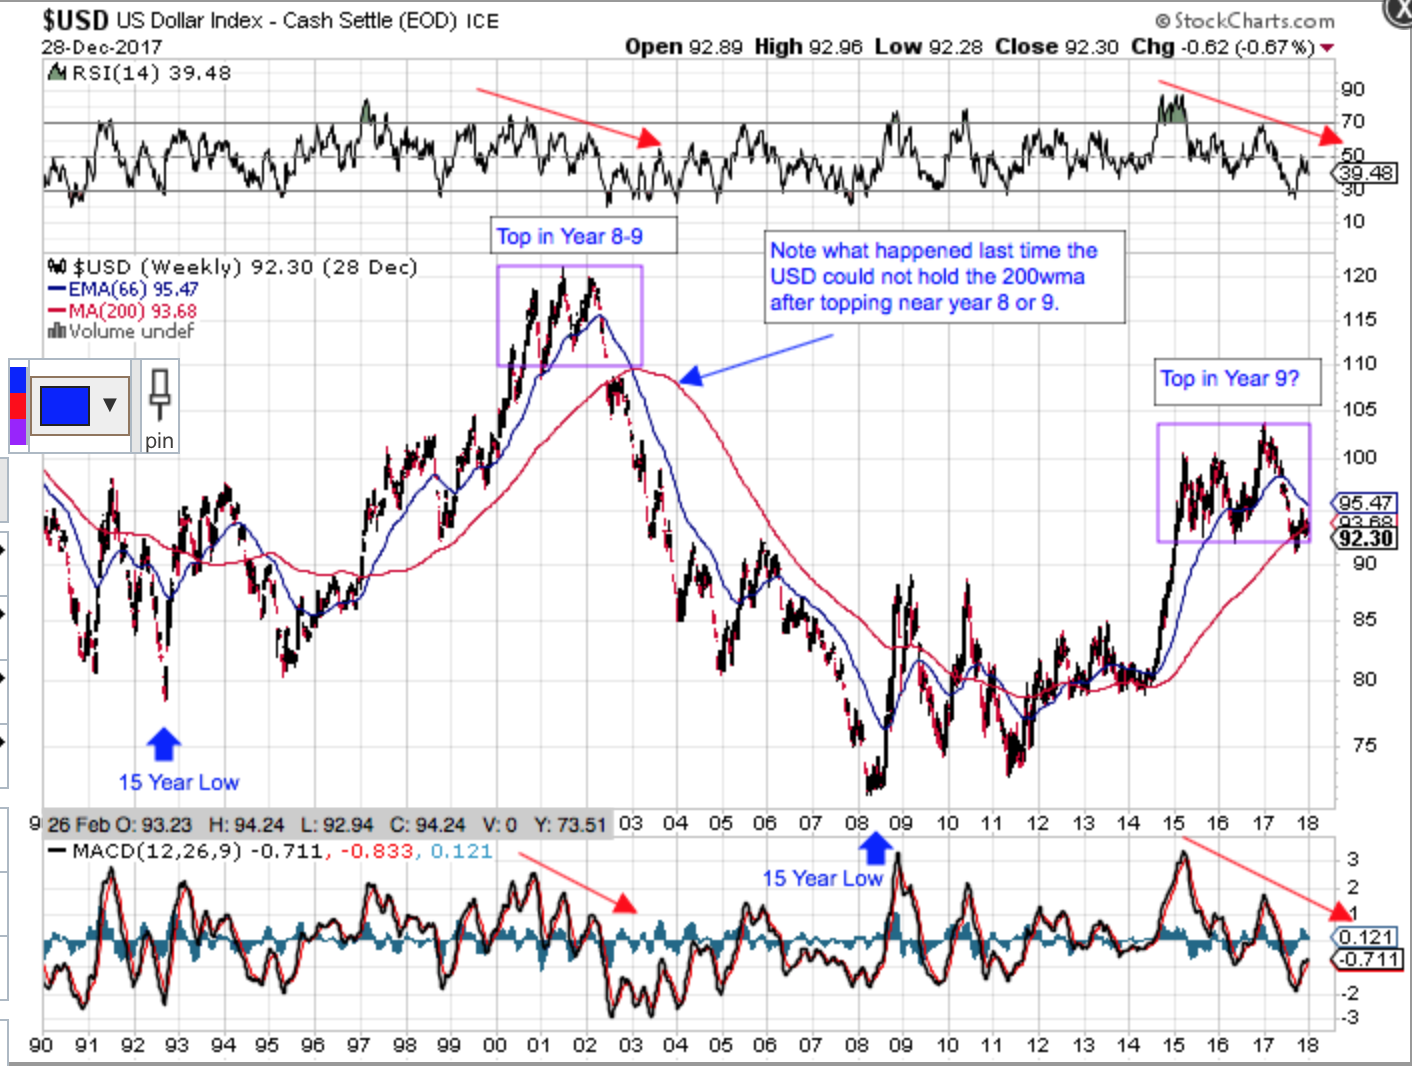
Everything also has a Yearly Cycle Low (YCL) which is nothing more than two 5-6 mont ICLs. Cycles longer than one year, however, vary by asset. The USD and Bonds have a 3 Year Cycle low to low and Stocks have a 7 Year Cycle low to low. Gold’s longer Cycles include a 4 Year Cycle and an 8 Year Cycle, which is simply two 4 Year Cycles back to back. Remember that longer cycles typically dominate shorter ones, meaning that if the longer cycle is in a bullish phase, most of its 5-6 month Intermediate Cycles will be right translated in terms of Time while making a higher high and a higher low (i.e. stair stepping up so to speak).
My first chart is a 28 year Gold weekly that shows Gold’s 8 Year Cycle pattern using the Purple Cycle tool on StockCharts. Cycles, however, are not exact, in terms of Time so I have added my Blue Arrows showing you that I believe Gold’s last 8 Year Cycle low came in early 2016 closer to the 7 year mark. The chart also shows a Blue Fork, that while not technically correct (handle does not attach), it does show you the long term Price channel I am tracking out of the 2001 low.
Why is this important? If Gold’s 8 year low to low pattern holds, the next one should be in the 2024 time frame. I also believe the USD’s longer 15 year Super Cycle has topped in Year 9 in early 2017. If correct, we should see downside price action in the USD for another 5 years, give or take a year. While the inverse correlation for the USD and Gold does not always hold, my expectations are that it will for much of the next 4-5 years as the USD moves into its longer term 15 year low. If correct, my expectations are that Gold will easily take out its previous high from 2011.


