This week price moves in the gold market could certainly give investors the creeps. The yellow metal opened at around $1,668 on Monday, closed $1,634 on Thursday and is currently (at the moment of writing these words) at $1,606.
We have stressed it many times that in order to make long-term investment decision one should put more weight on long-term charts rather than focusing on short-term noise. Today we will focus on the long-term gold chart - it gives the most insight into what may happen in the long run. Let us jump straight into it. (Charts courtesy by http://stockcharts.com)
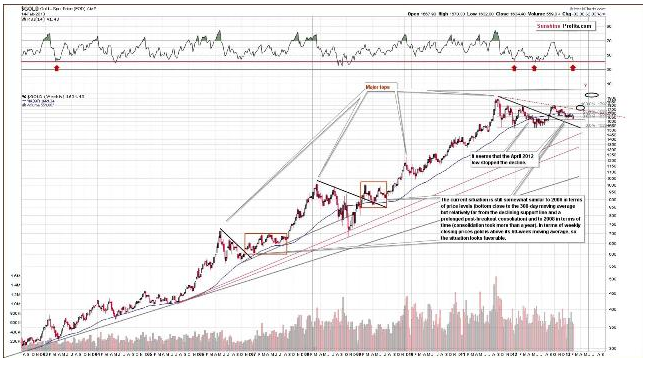
There are two things to focus on in this chart. The first is that the RSI levels have declined and are now at a level equal to those seen at the 2011 and 2012 bottoms, it seems very likely that a major bottom is either in or at hand now.
The second important point is that we have discovered a long-term cycle when analyzing gold market consolidations and how they evolve to rally and top. We generally project the price path that will be seen next, however, this time we thought of looking at when a top could be seen and inferring how gold might get there.
Note that the second stage of the gold bull market began in 2006 (breakout in terms of euro, acceleration in terms of the US dollar). From the major bottom in that year and after, we see strong relationships and that every two years or so, we have a major top preceded by a sharp rally.
The coming top (long-term cyclical turning point) is suggested in late May, so a sharp rally is expected very soon, that is, prior to the May top Note that before this rally there may still be some short-term turmoil on the market – since we are talking about long-term signals, it is very hard to give a very precise starting point for a rally. This is yet another confirmation of our bullish theory for the coming weeks and months and supports staying in the market at this time.
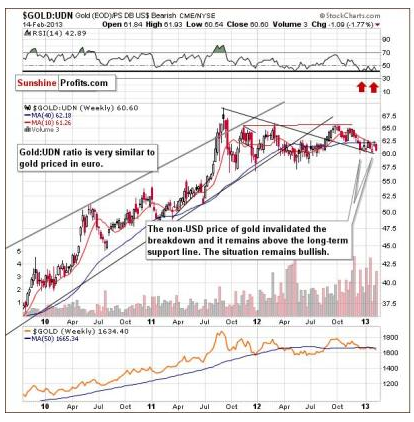
The second gold chart for today is also of long-term nature. 
In this week’s chart of gold from the non-USD perspective, we still see a bullish picture. Prices have consolidated after breaking out, and while the situation looks a bit discouraging (as not much happened in the past few months), it is still overall bullish in our view.
Summing up, the situation for the yellow metal remains bullish at this time. The analysis of this week’s long-term chart uncovered some bullish signals based on a study of trading patterns seen since 2006. As always, implications gleaned from long-term charts carry more weight than those from shorter time periods and are the most important factors to be considered from this week’s gold section.
The bullish situation remains in place and RSI levels suggest an oversold situation similar to the major bottoms of 2011 and 2012. Although the short-term picture looks grim, the long term one is really encouraging, even though an additional short-term decline may be seen before the big rally.
- English (UK)
- English (India)
- English (Canada)
- English (Australia)
- English (South Africa)
- English (Philippines)
- English (Nigeria)
- Deutsch
- Español (España)
- Español (México)
- Français
- Italiano
- Nederlands
- Português (Portugal)
- Polski
- Português (Brasil)
- Русский
- Türkçe
- العربية
- Ελληνικά
- Svenska
- Suomi
- עברית
- 日本語
- 한국어
- 简体中文
- 繁體中文
- Bahasa Indonesia
- Bahasa Melayu
- ไทย
- Tiếng Việt
- हिंदी
Long-Term Trading Cycles In Gold And Their Implications For Future Price
Published 02/17/2013, 02:41 AM
Updated 05/14/2017, 06:45 AM
Long-Term Trading Cycles In Gold And Their Implications For Future Price
Latest comments
Loading next article…
Install Our App
Risk Disclosure: Trading in financial instruments and/or cryptocurrencies involves high risks including the risk of losing some, or all, of your investment amount, and may not be suitable for all investors. Prices of cryptocurrencies are extremely volatile and may be affected by external factors such as financial, regulatory or political events. Trading on margin increases the financial risks.
Before deciding to trade in financial instrument or cryptocurrencies you should be fully informed of the risks and costs associated with trading the financial markets, carefully consider your investment objectives, level of experience, and risk appetite, and seek professional advice where needed.
Fusion Media would like to remind you that the data contained in this website is not necessarily real-time nor accurate. The data and prices on the website are not necessarily provided by any market or exchange, but may be provided by market makers, and so prices may not be accurate and may differ from the actual price at any given market, meaning prices are indicative and not appropriate for trading purposes. Fusion Media and any provider of the data contained in this website will not accept liability for any loss or damage as a result of your trading, or your reliance on the information contained within this website.
It is prohibited to use, store, reproduce, display, modify, transmit or distribute the data contained in this website without the explicit prior written permission of Fusion Media and/or the data provider. All intellectual property rights are reserved by the providers and/or the exchange providing the data contained in this website.
Fusion Media may be compensated by the advertisers that appear on the website, based on your interaction with the advertisements or advertisers.
© 2007-2025 - Fusion Media Limited. All Rights Reserved.
