March is officially over, and it’s time we prepare for a new trading month.
I finished my weekend market analysis, and I have a few Forex pairs on my April watch list.
For April, I have decided to add a few more details to my analysis. For example, if I am spotting a potential signal I am going to add a few technical indicators, but this is just so i can confirm my analysis, not to decide my bias, but to double check it!
Color map of the trendlines:
Pink: Monthly
Blue: Weekly
Red: Daily
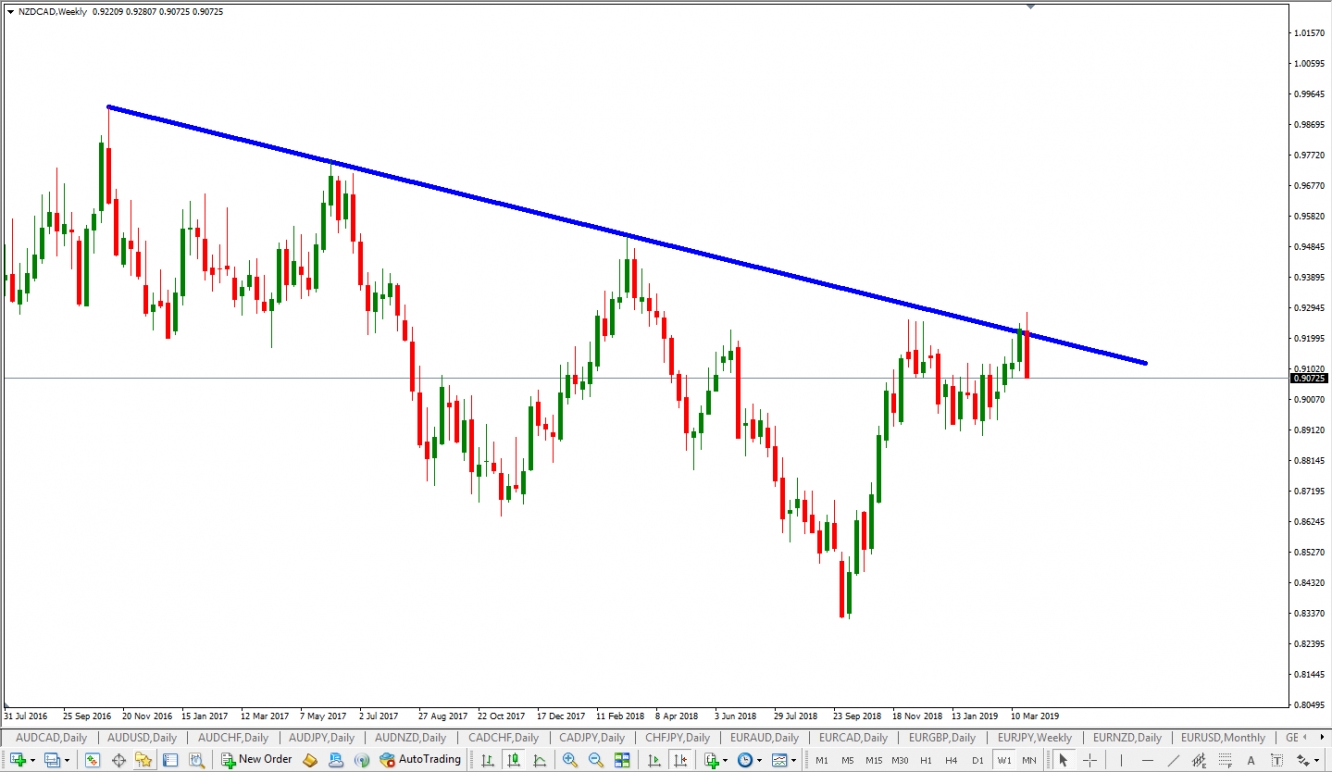
NZD/CAD – Weekly Descending Trendline
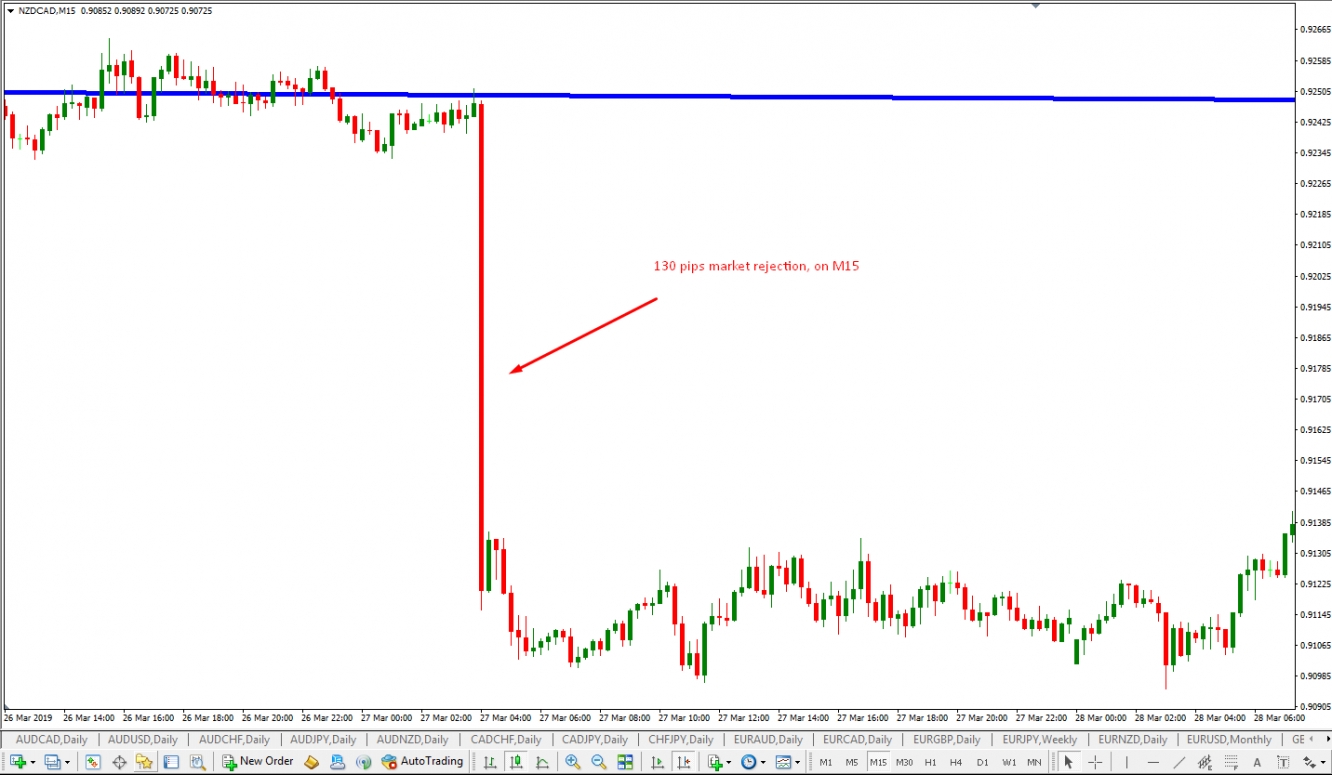
NZD/CAD has been in a downtrend for the past 3 years on the Weekly Time Frame. Currently price is retesting this long term trend line. The last 2 bars on this pair gave us 2 different bounce formation, within one, and both of them are high probability candle stick formations. I am talking about “Railway Tracks & Outside Bar”. Both of them signify heavy market rejection. Even though the bears are obviously in control, and there is a lot of room for a 300+ pip move here, I am a little worried, that the initial rejection happened in huge momentum, and can be spotted on the smaller time frames. In any case, trading is about reacting what is currently happening, not about predicting what is going to happen, so I am going to stick to my trading plan for this pair.
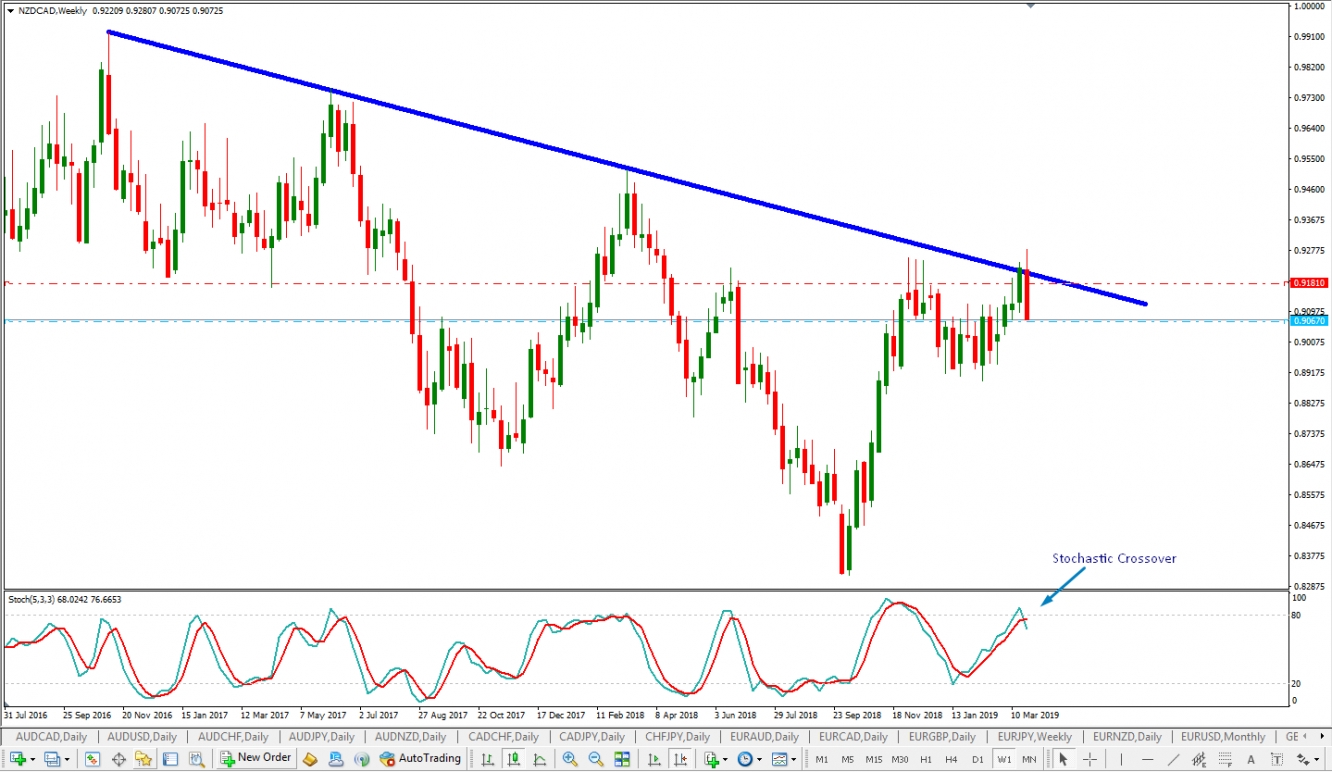
And just a side note for my bearish bias, the Stochastic has already crossed over so momentum has definitely shifted towards the downside of this move.
My plan of action for this pair is already prepared, since this is a valid signal. A pending “Sell Stop” order, where the entry is 5 pips bellow the lowest point of the formation, and Stop Loss 5 pips above the 50% of the entire formation. Even though my Stop Loss is considered aggressive, I need to bare in mind that if I place it 5 pips above the entire formation, my SL will be more than 200 pips, and my Risk/Reward ratio will suffer immensely because of this. But of course, if this setup does not pan out, I do not need a 200 pip retracement to tell me that.
Entry: 0.90670
Stop Loss: 0.91810
Take Profit: 50% upon close of the first candle that activated the position, and another 50% upon the close of the second candle.
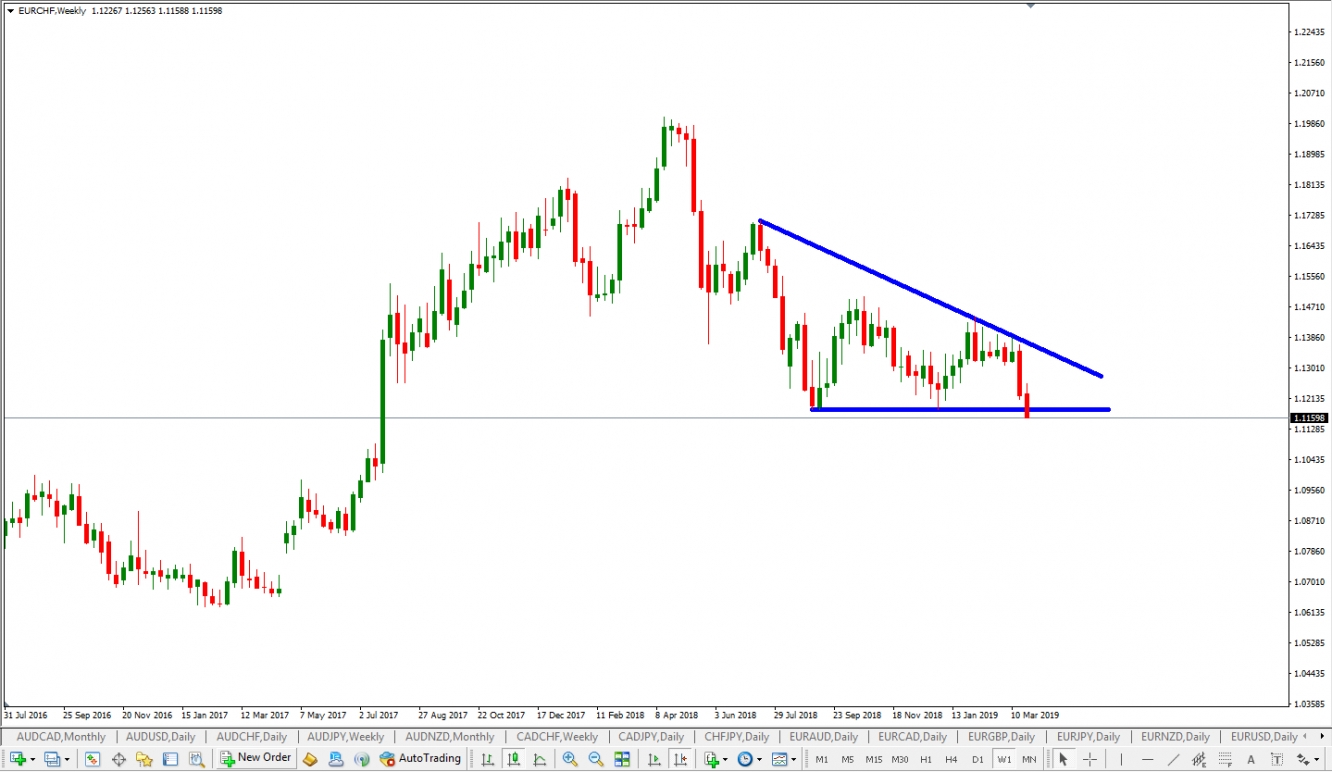
EUR/CHF - Breakout of a Descending Triangle on the Weekly Time Frame
The EUR/CHF has been entrapped inside a descending triangle since July 2018. Last week’s candle finally made an attempt to breakout of this triangle, and broke the weekly support line. The most important thing here is that last week’s candle closed below the support, so for now the bears are still in charge. What I want to see happen within the next few bars is basically retesting of the previous support level now turned in to resistance, and then a continuation move down – BPC (Breakout – Pullback – Continuation). If I see this happening, I will write a separate article on this setup alone. For now, since we are looking at the Weekly Time Frame, this pair is on my April Watch list.
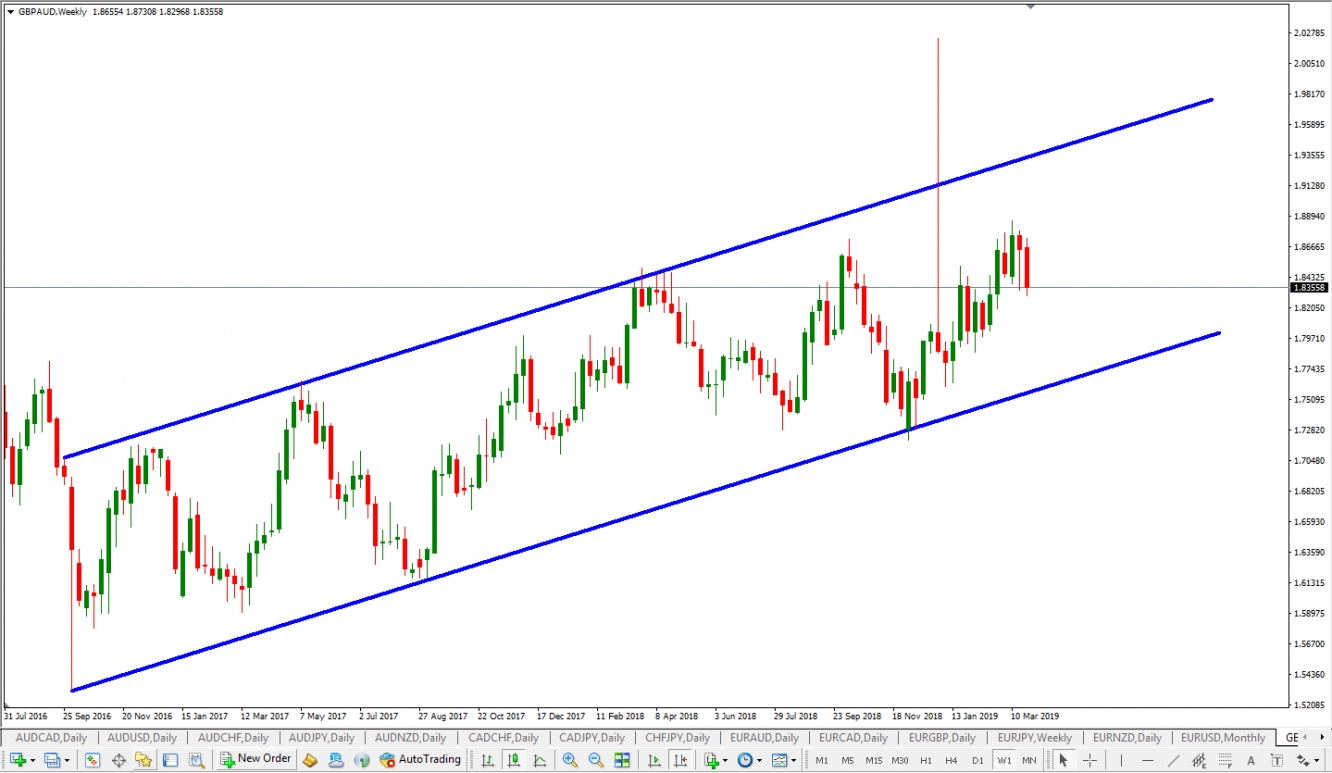
GBP/AUD – Ascending Equidistant Channel
The GBP/AUD since Septembar 2016 has been in a Ascending Equidistant Channel. In January 2019 when price retested the support line of this channel, we did not get any trading signal on the weekly time frame. What I would like to see happen now is again for price to retest the support level of this channel, and to get a signal to go long, since I do not feel comfortable trading against the trend when price is retesting the resistance line of the channel. But if I do not get any of the typical formations I would like to trade, I am also willing to zoom in to the shorter time frames to possibly look for a long opportunity there – I specifically mean the 1D and 4H Time Frames.

