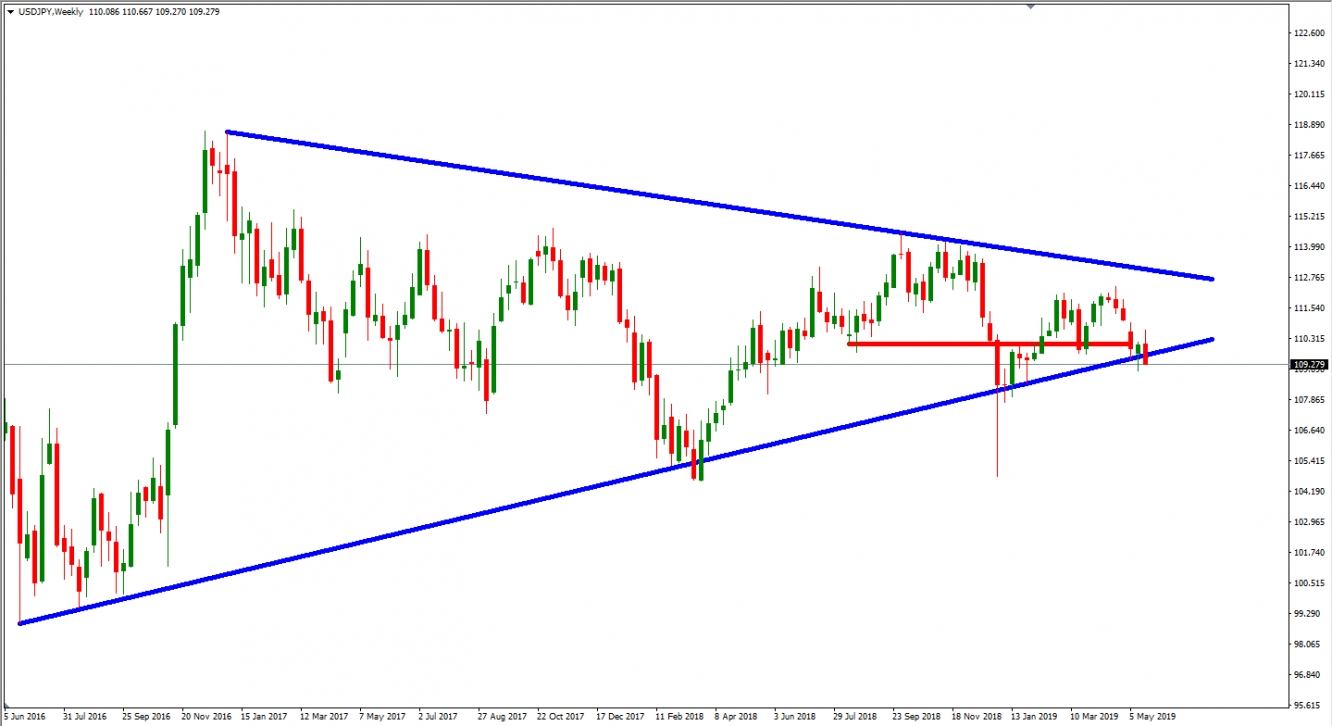
USD/JPY – Triangle, Weekly Time Frame
We kick it off with a triangle on USD/JPY. This triangle has been in the forming since 2016, and finally, it is approaching its time vortex. The rice has been compressing for the past few years, and in the following bars we might see a full breakout.
Breakouts out of these long term setups can give us a huge “Risk to Reward” ratio if we can get a proper entry. The only issue I have is that there is no clear bias. It can go either way, but if we have no bias, that does not mean that we can not trade any potential signal we receive, it just means that we have to be extra conservative with our entry policy. If we do get a breakout, I am looking for three potential scenarios to trade:
- Breakout – Congestion – Continuation
- Breakout – Retracement – Continuation
- Breakout – Full Swing Retracement
In all 3 scenarios, I am looking for a confirmation of the breakout in the shape of a retest of the support/resistance area where the breakout happened. In order to protect my self, since there is no
clear bias, I am taking the following measures:
- Instead of 3%, I am risking 1,5% of my balance
- Stop Loss will be placed above/below the formation, not on the 50% mark
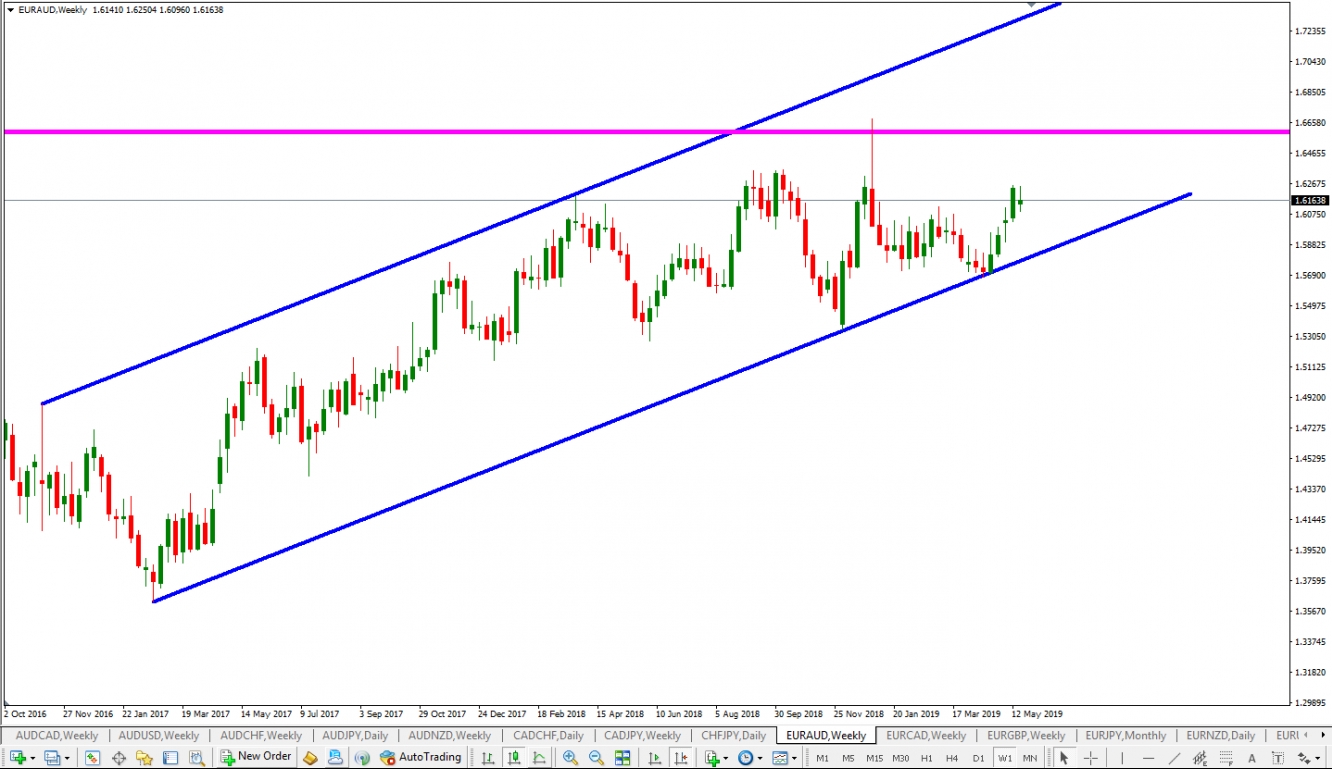
EUR/AUD – Weekly Ascending Channel
The EUR/AUD price is nowhere near where I want it to be. This is also a channel that has been happening since 2016, and there is no reason why we shouldn’t take a high-quality trade if we get a good signal.
In this scenario, I am only looking to trade long positions. I am aware that there are traders who trade both bounces from the lower and upper boundary of the channel, but that is too risky for my taste.
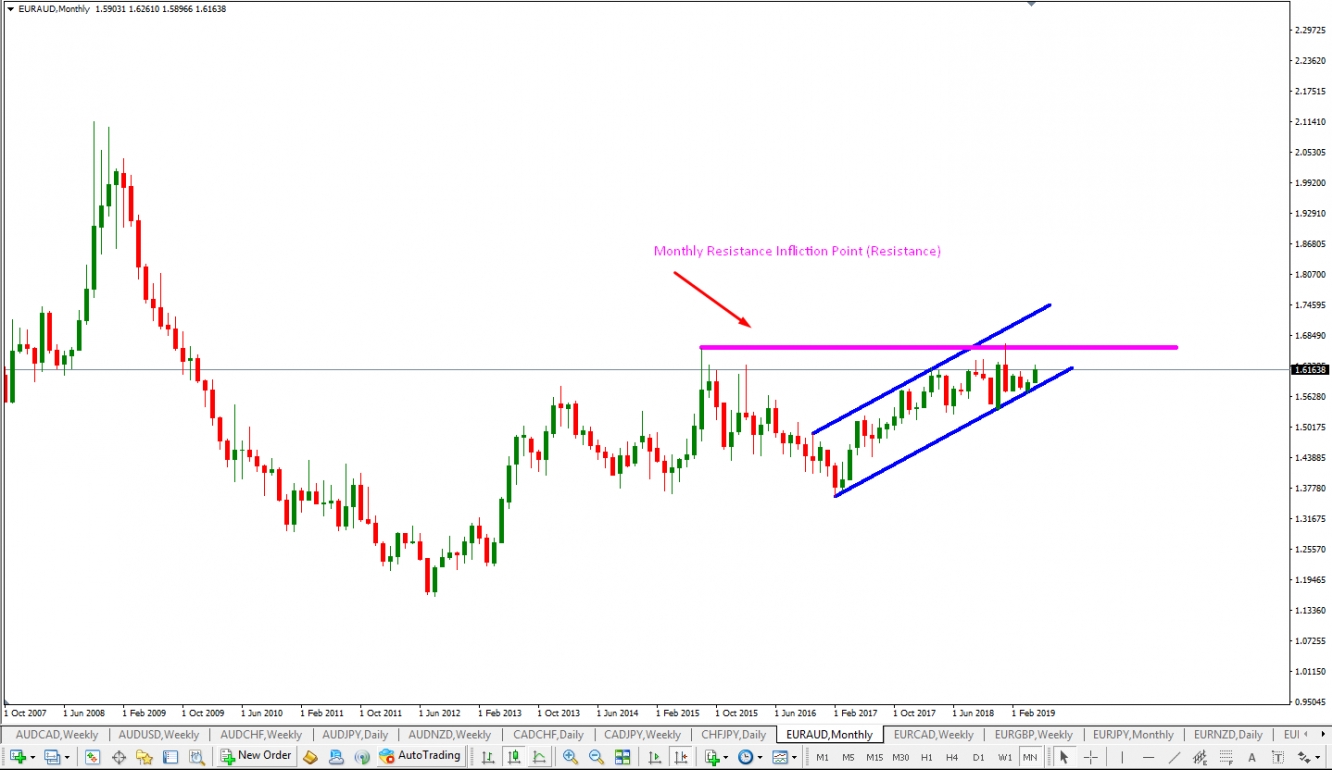
The only downside on this setup is that it’s coming very close to a monthly level of resistance. There is plenty of time until we actually get a potential trading signal, so by then, this monthly resistance might turn into monthly support (hopefully).
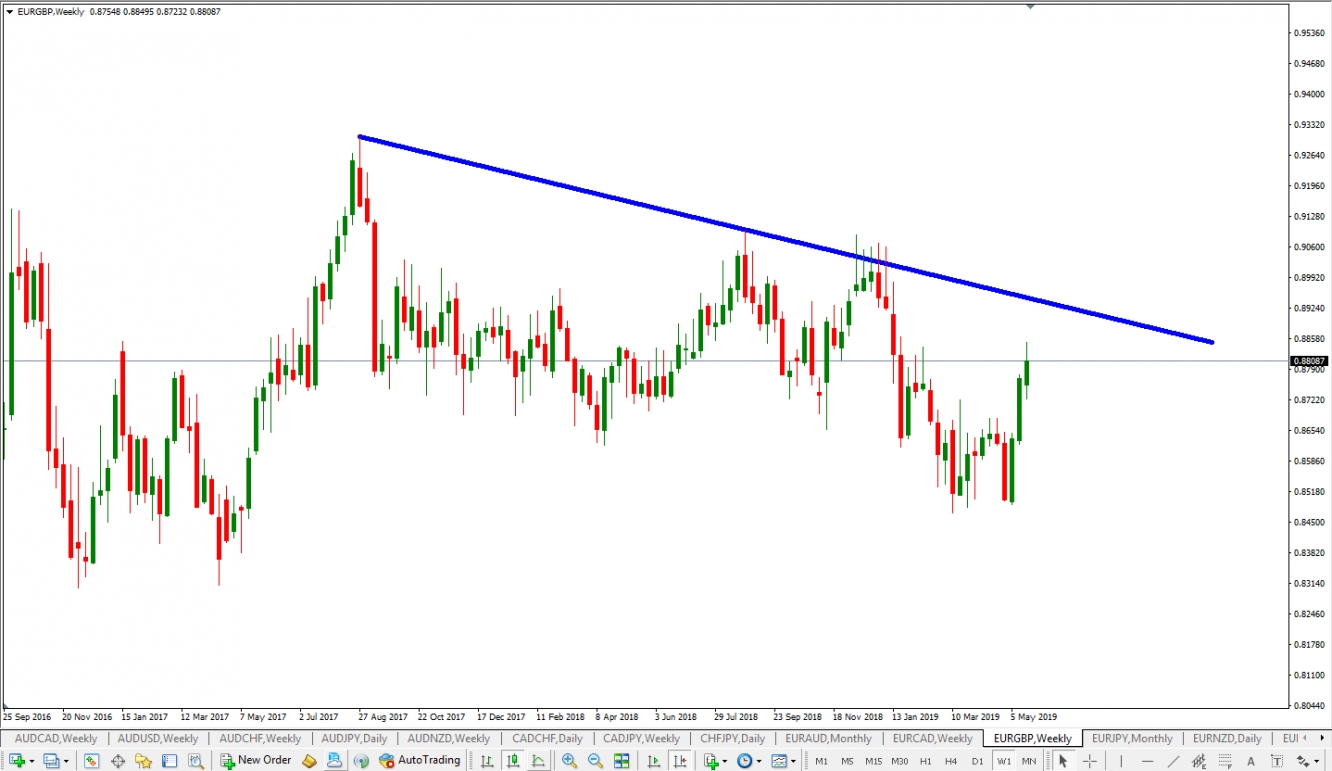
EUR/GBP – Weekly Time Frame, Descending Trend Line
This is the setup that may provide us with signals in the next two weeks if all goes well, but in any case, it’s the closest one in this analysis.
Since July 2017 price has been making lower lows and lower highs, and each time the trendline has been respected. Currently, the EUR/GBP is in retracement mode for the third time, and I have a strong bias that it will bounce from the trendline and also create a new low for this pair. However I am not aiming to exploit the full swing to the downside, but only the initial reaction, which I am hoping will get me somewhere around 250 pips more or less.


