Key Points:
- The double top remains intact despite the recent hiccup.
- Neckline is currently being challenged.
- Fundamental and technical biases are in agreement.
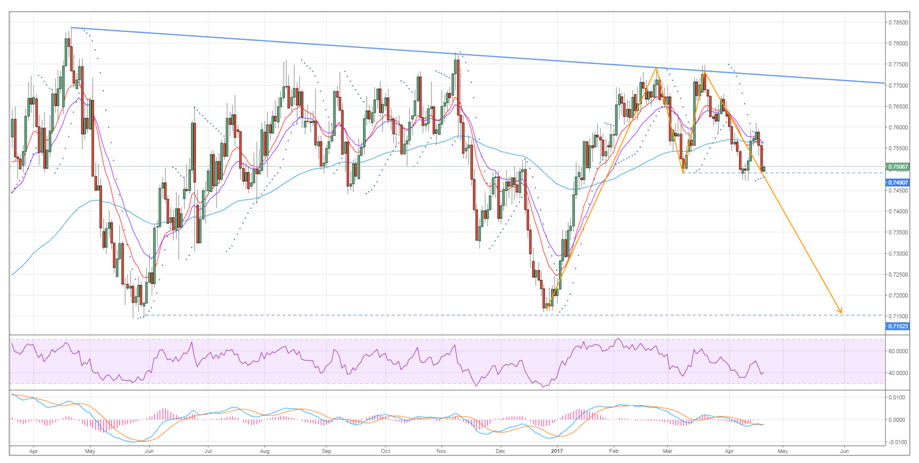
The Aussie Dollar’s long-term technical forecast was in danger of being upset last week but the pair’s recent tumble back to support has revived the bear’s hopes for a major downtrend taking hold. What’s more, the broader argument for ongoing losses is looking stronger than ever which could see the neckline of the overarching chart pattern broken over the coming days, even in the absence of a major fundamental shift in sentiment.
First and foremost, let’s identify exactly what the above mentioned overarching structure is and what it could mean moving forward. As illustrated below, the pattern we have been tracking recently is a fairly well defined double top with peaks around the 0.7735 level and a neckline evident around the 0.7490 handle. This neckline has come into focus over the past 24 hours given that it is once again being challenged and looking just about ready to yield to selling pressure.

As for what this means in the medium to long-term, a breakout now could bring us into a period of fairly sizable losses. Indeed, if the retracements of the double top are any guide, the AUD/USD could plunge back to even the 0.7150 mark by June. However, we have had a similar bias only recently so it may warrant taking a closer look at some of the other technical indicators to gauge whether we are truly going to see a breakout and subsequent decline for the pair.
Firstly, as was the case previously, the EMA configuration is highly bearish and the two shorter period averages are on the cusp of completing a crossover with the 100 day EMA. However, unlike last time, the MACD has just returned to bearish and the stochastics are much less oversold which will see downside risk increase substantially. In fact, one of the only impediments to a breakout comes from the Parabolic SAR which is currently bullish. Regardless, this shouldn’t present much of a real impasse given that it is also on the verge of inverting back to bearish if we have even a modest sell-off moving forward.
Ultimately, despite some recent doubt being cast on the long-term forecast, there is still a fairly strong argument for the decline suggested above. Moreover, this technical bias fits rather well with the broader fundamental case for continued losses as a result of crumbling demand for Australian iron ore. Due to this, it’s worth monitoring that neckline closely as, once it breaks, the bears are likely to swiftly seize control of the pair.
