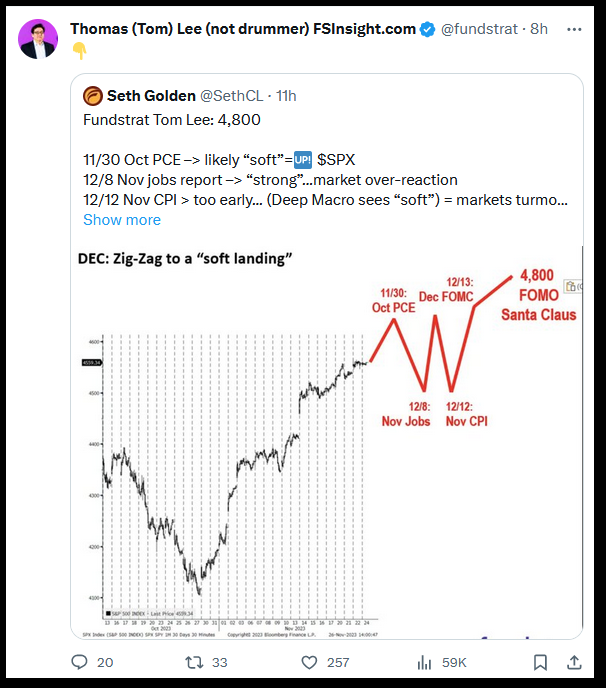
I must clarify that with all of the huge gains in November and beginning widespread exuberance, the historic data supports some level of weakness in early December before a final year-end “Santa” rally. Here are two takes – one quantitative (data since 1950)), one qualitative:
If you missed last week’s podcast|videocast with the Holiday, you may want to check it out here. It was one of the most important of the year:
As we wind down an amazing earnings season, I’m trying to highlight the results from 1-2 companies per week that we have talked about on our weekly podcast|videocast(s). Today we’ll do a deep dive on MMM and CCI:
3M (NYSE:MMM) Update
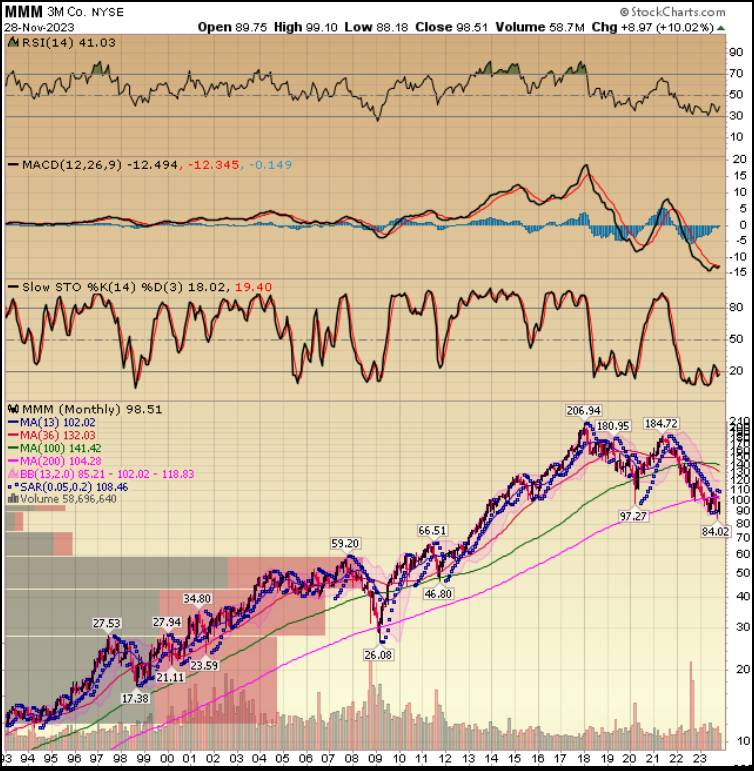
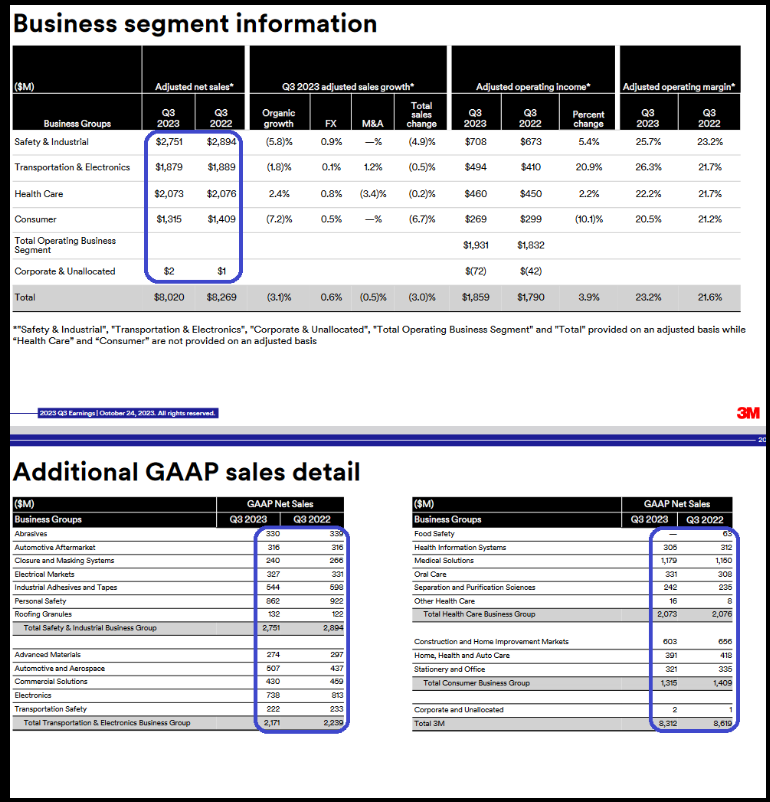
While 3M has started to show early signs of recovery from when we first started talking about it on our weekly podcast|videocast(s), we believe it is just getting started on a massive multi-year recovery. Here is a detailed update from the most recent earnings call, presentation and other developments:
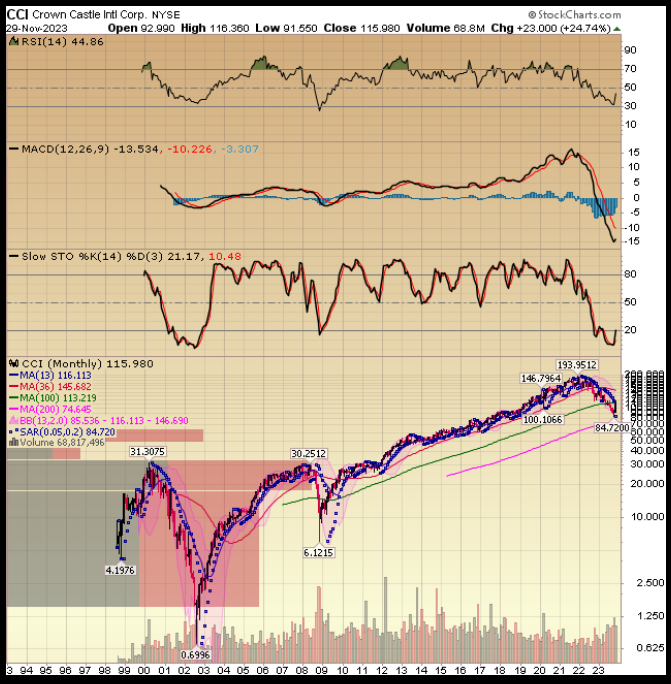
CCI Update
Billionaire Activist – Paul Singer’s Elliott Management has begun a new Activist campaign on Crown Castle (NYSE:CCI). If you have been a regular viewer of Charles Payne on Fox Business, a client, or regular listener of our podcast|videocast you would have seen the value before the campaign started:
BABA Update
The Chinese are strengthening the Yuan (solid black line circled in green below) again. It has begun to rise since Xi’s speech at the APEC meeting in San Francisco two weeks ago. In the face of strong tension with the US he claimed with his words that China was ready to be a “partner” and “friend” to the US. He spoke of a peaceful coexistence, cooperation and “mutual respect.” He vowed to “never pursue hegemony or expansion.” Words are one thing, but it was immediately followed up with action. See the green circle on the bottom right to understand the move in the Yuan (straight up off of 15 year lows). A stronger Yuan makes China’s exports LESS competitive. This is am olive branch (potentially in exchange for future tariff reduction) – we’ll see.
Alibaba’s stock price has outperformed during periods of rising Yuan and collapsed during periods of weakening Yuan. Will the ~$28.10B (last 4 quarters) of annual free cash flow generation (+27% YoY growth last quarter alone) and Chinese market cloud leadership start to matter once again?
We’re going to find out shortly.
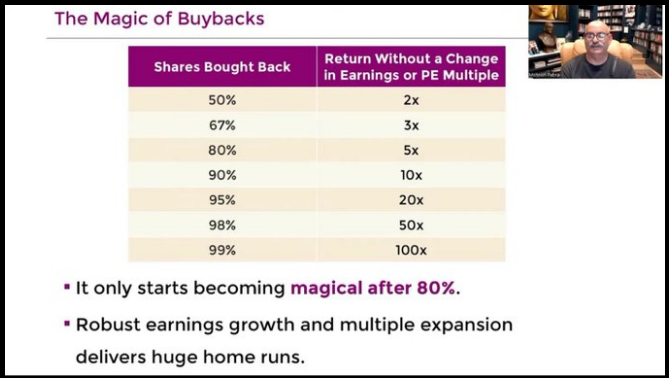
To put things in perspective, if the exchange rate were to revert to 2017 levels, that same $28.10B of Free Cash Flow becomes $33.12B without any business improvement. If we continue to grow at 27% (which the last 4 quarters’ avg. growth was higher), you’re at $42B of annualized free cash flow. Add the net cash on the balance sheet you could buy in the entire company in ~3 years. What does that hypothetical look like? Here is a generic table from Monish Pabrai:
All the best fundamentals in the world won’t matter, until they do. We spent an hour on Alibaba’s fundamentals, developments and the future last week. As the rest of the portfolio has appreciated, the percentage weight of Alibaba (NYSE:BABA) has declined (despite no change in shares held). Where appropriate (and below our position size threshold), we added size (in some cases AGGRESSIVELY) in the past couple of days in order to get Alibaba back up to a meaningful weight in the portfolio.
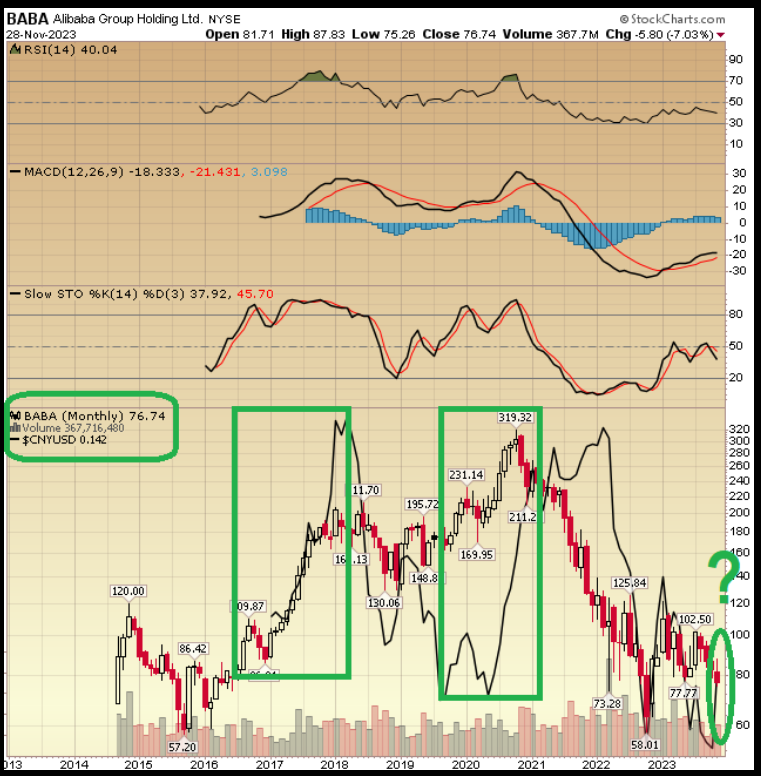
Will good things happen before the end of the year for Alibaba? Who knows. There may be some more tax loss harvesting in early December (if there are any sellers left!). I’m perfectly content to let the company bank cash and buy in shares all day long while the rest of the portfolio continues to appreciate.
One day people will wake up to the fact that the share count is down 50% and the stock is up 4x. When they come to that realization, and are scrambling to chase the stock, we’ll be happy to help them out with all the NEW and OLD stock we own. Until then, we’ll sit on our hands and wait. Why? Because there is no better alternative high quality business with similar upside to replicate a current ~21.8% Free Cash Flow yield:
Market Cap: 190B + Debt: (1.12 + 14.18 + 7.5 = 22.9B) = 212.9B – Cash & Equiv: 83.8 = $129.1B
/ Free Cash Flow (6.198 + 5.391 + 4.698 + 11.818)= $28.1B FCF = 21.8% Free Cash Flow Yield. Find me a better growing business I can buy with a 21.8% Free Cash Flow yield – committed to restoring double digit ROIC – and I’ll listen. I have never seen a better quality business (with more upside optionality) – temporarily available at such a low price – in my career.
RIP Charlie…
Now onto the shorter term view for the General Market:
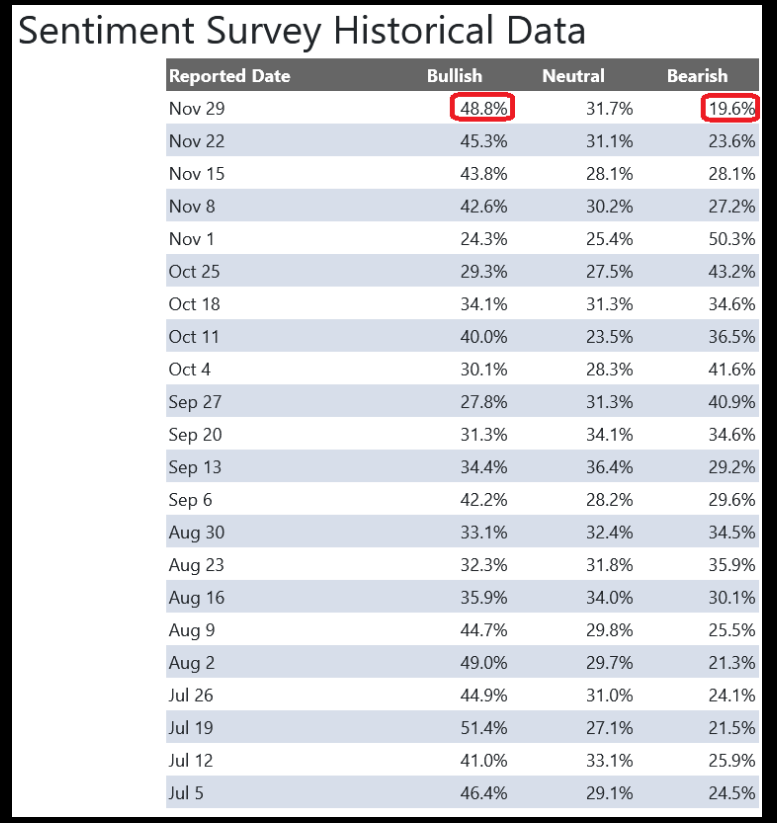
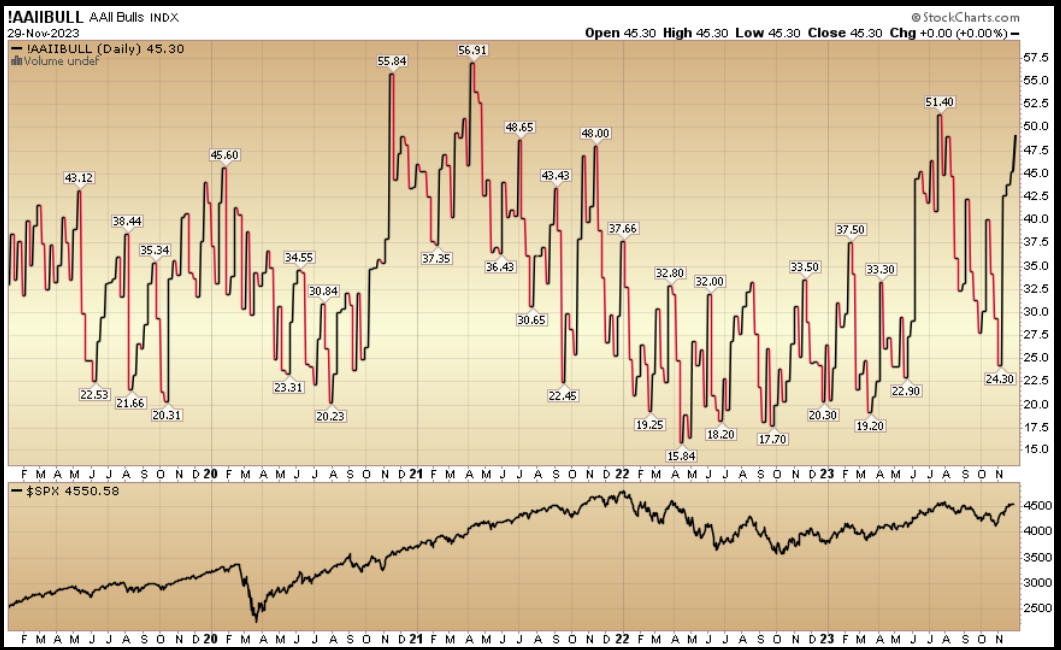
In this week’s AAII Sentiment Survey result, Bullish Percent (Video Explanation) rose to 48.8% from 45.3% the previous week. Bearish Percent dropped to 19.6% from 23.6%. Retail investors are becoming giddy. This level can stay elevated during major moves (see below), but be open minded to a little give-back in markets (in the short term) to knock the certainty out of their mind before moving higher.
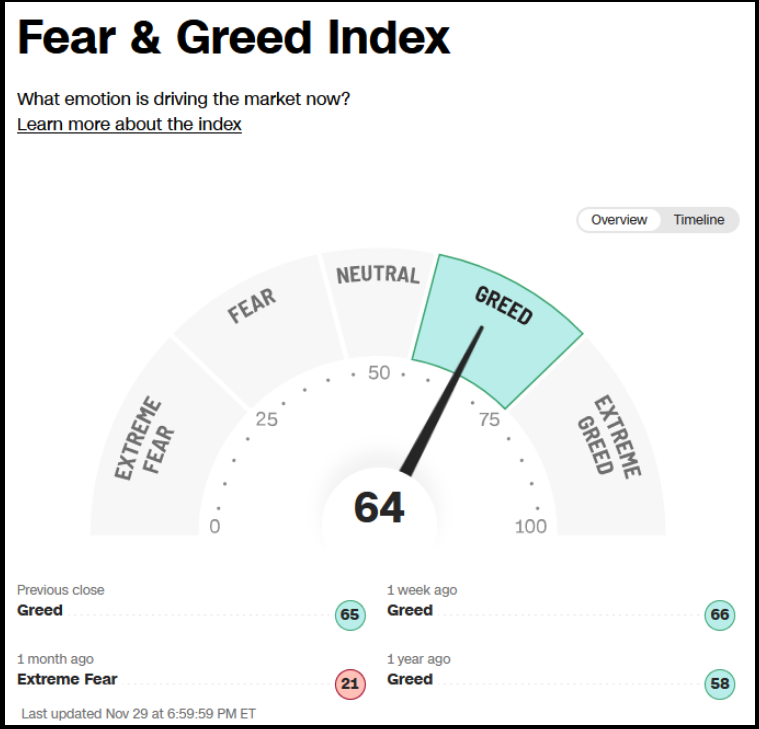
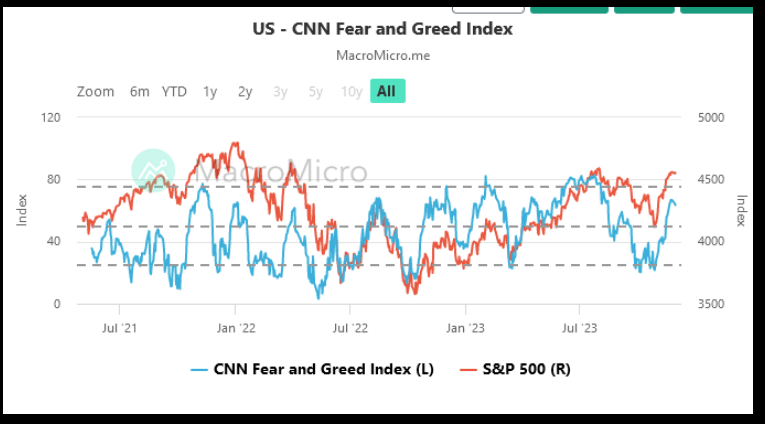
The CNN “Fear and Greed” flat-lined from 64 last week to 64 this week. By this metric, investors are a bit giddy, but not yet euphoric. You can learn how this indicator is calculated and how it works here: (Video Explanation)
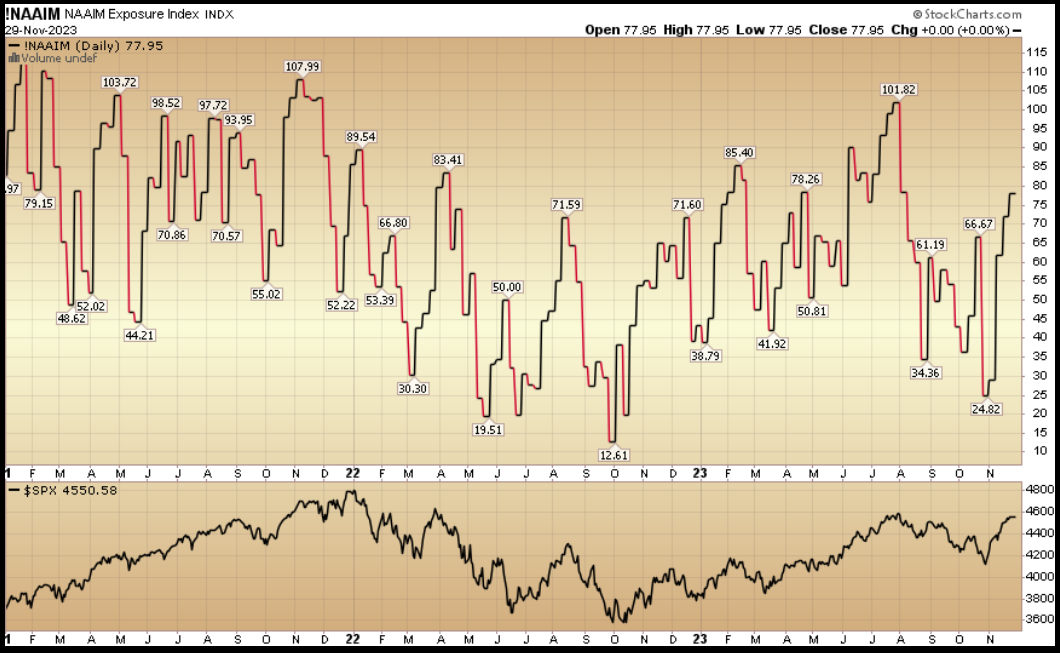
And finally, the NAAIM (National Association of Active Investment Managers Index) (Video Explanation) moved up to 77.95% this week from 61.75% equity exposure two weeks ago. The year end chase is ongoing:
This content was originally published on Hedgefundtips.com.

